Trading the corn futures markets has its appeal for traders interested in the grains market. Corn futures are no different from other grains such as wheat and the factors affecting the corn markets are almost similar. However, when you look closer there are a few other factors that make corn futures a truly unique agricultural futures product. Corn finds its use in many different segments. It serves as a feed for livestock such as cattle, hogs and poultry which tends to act as a catalyst in influence the futures prices for live and feeder cattle futures and hogs futures. Corn is also used as a base for producing ethanol a fuel additive that has only grown in its usage. It is estimated that over 40% of corn produce goes into ethanol production, which makes it distinct from other grains such as wheat for example. Only a small portion of corn production goes into human consumption with various versions including corn oil, corn starch and sweeteners used in food processing and preparation. When trading corn futures, traders need to account for a lot of factors. Here, we list the 7 things that influence the corn futures markets.
#1 – Corn futures contract specifications
Corn futures are traded at the Chicago Board of Trade (CBOT) which is the futures exchange for corn and other commodities. There are many different formats of corn futures. Below is a comparison of the CME group standard and mini-sized corn futures contracts.
| |
Standard Corn Futures |
Mini-sized Corn futures |
| Ticker |
ZC |
XC |
| Contract Unit |
5000 bushels |
1000 bushels |
| Trading Hours |
Sun – Fri: 1900 – 0745 CT and Mon – Fri: 0830 – 1330 CT |
| Minimum Tick |
¼ of a cent per bushel |
1/8 of a cent |
| Tick Value |
$12.50 per contract |
$1.25 per contract |
| Listed Contracts |
Mar (H), May (K), Jul (N), Sep (U), Dec (Z) |
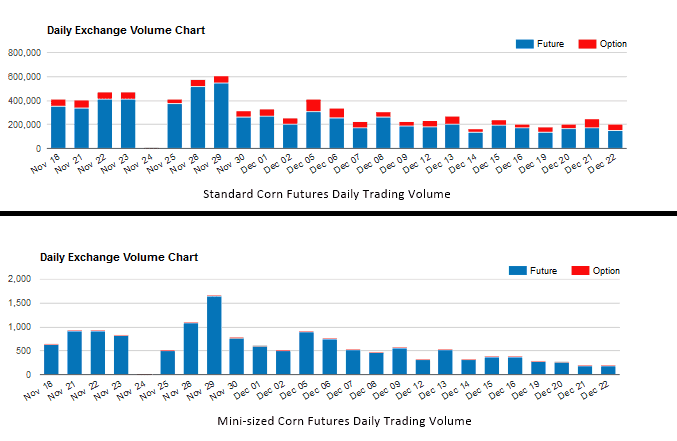
Between the two contracts, the standard corn futures contracts attract a higher daily average trading volume compared to the mini-sized corn futures contracts.

Comparison of daily trading volume of standard and mini-sized corn futures contracts (Source CME Group)
#2 – Seasonal trends in corn futures chart
Corn is a highly seasonal commodity with trading subdued during the winter months while the summer months can show wild swings in prices. The seasonal trends in corn are based on the plantation and harvest periods. Corn is typically planted in spring and harvested during the fall months. The period between planting and harvesting is one of the most volatile months for corn futures as speculators start to move prices around based on expected supply and demand factors. The winter months are usually the quietest periods in corn futures where most of the trading in the corn futures are based on the week to week shifts on the demand side of the spectrum. On the other hand, during the summer months, corn futures traders need to focus on many different aspects such as weather which could evidently impact the harvest.

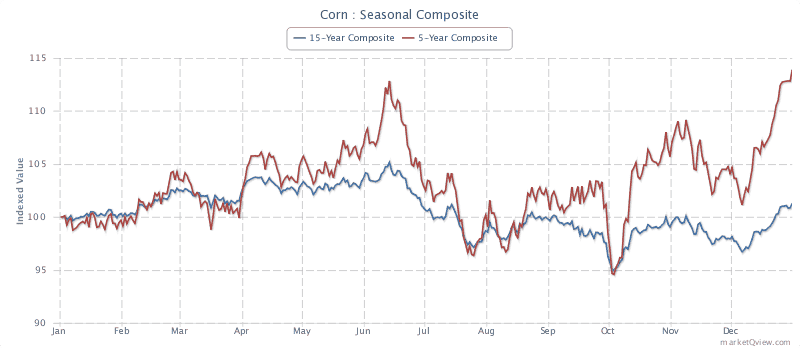
Corn futures seasonality based on a 15 and 5 year composite view (Source Marketqview.com)
The chart above shows the seasonal trends in corn futures price. Price action in corn futures is relatively flat during the first few months of the year and volatility picks up around early April or May. As the planting season comes closer, the volatility in corn futures starts to increase as well with the highest action seen during the June and July months. It is also around this same period that corn futures tend to make a seasonal high before price start to pull back. The August and September months typically see corn futures moving sideways on a long term basis before volatility picks up around the late October period and into the winter months.
#3 – USDA reports and influence on corn futures contracts
The United States Department of Agriculture (USDA) releases a set of report which usually set the expectations in the supply and demand on a very fundamental basis. One of the reports issued by the USDA is the Planting intentions report which comes out during end of March. The report gives an overview of the market for the season and highlights key information as the amount of acreage that farmers intend to plant for the crop. In early January, the USDA releases the annual crop summary which gives a comprehensive view of the production numbers for the previous year and also gives information on the stocks of corn at all positions towards the end of the year. This gives an overview on the potential harvest that comes out from the plantation area. There are some technical aspects to the report as well as most analysts have come up with a calculation of multiplying the acres by a trend yield to project the expected crop for the season. Besides the March report, the USDA also releases a weekly export report every Thursday. This report gives details on the demand for corn exports. A strong export market usually bodes well for corn futures prices. Corn futures traders also need to pay attention to the price of corn from other exporting countries. If the pricing of Corn from the U.S. is not competitive enough, demand tends to quickly fall off.
#4 – Effects of weather on corn futures prices
Weather plays a crucial role in almost any commodity that requires sowing and harvesting and Corn is not immune from this. The climate effects on the corn plantation can have either a near term or a long lasting effect which could potentially influence the prices of corn futures. As corn futures traders and more importantly for day traders it is best to do some research before entering a position. Due to the various weather departments that can issue reports, it is not hard to see surprise volatility in the corn futures. Doing a bit of research beforehand for any upcoming weather report releases can be helpful to the corn futures traders. No matter how strong one’s analysis is of the corn futures markets; accounting for the weather plays a bit role and is one of the fundamental factors that can affect the price of corn futures.
#5 – Ethanol demand and impact on corn futures prices
Believe it or not, ethanol prices play a major role in influencing the price of corn futures. This is because corn is the main feedstock in the U.S. for producing ethanol fuel. Over 40% of corn goes into fuel production while the remainder goes towards feed for livestock (which tends to influence prices of cattle futures) and only a small portion of the supply goes towards human consumption. Ethanol is mostly used a fuel additive. Between the periods of 2013 – 2014 over 13 billion bushels of corn were produced of which a majority went into ethanol production. Over 98% of ethanol production comes from corn. It is estimated that one bushel of corn can produce 2.8 gallons of ethanol. Demand for ethanol has been in a steady increase since the 1970’s as the U.S. government mandated an increase of ethanol in gasoline and other similar products. In 2011, the U.S. Environmental Protection Agency allowed up to 15% of ethanol blended gas to be sold commercially A higher demand for ethanol leads to higher demand in corn as well thus leading to higher prices. The positive relationship between ethanol and corn is higher during cycles of expansion but the relationship is not that strong during periods of weaker demand.

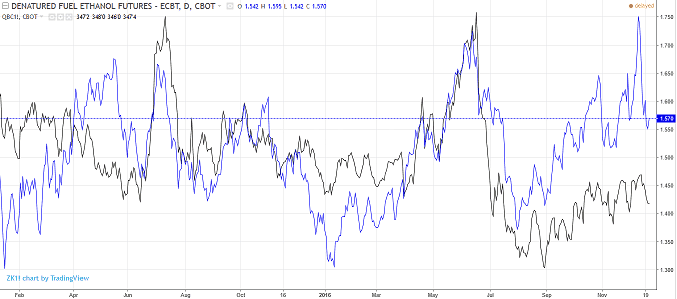
Price comparison of corn futures and ethanol (Source Tradingeconomics.com, Tradingview.com)
The above chart shows a comparison of the ethanol futures (blue line) and the Corn futures (black line) prices which shows the strong correlation between the two commodities.
#6 – Hedgers/Speculators positioning in corn futures markets
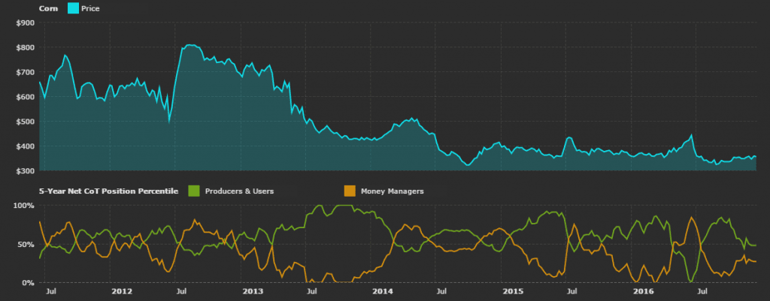
For the corn futures day trader, the price action in the markets eventually comes down to how the smart money is positioned compared to the hedgers. The hedgers can be in the form of corn producers or consumers such as factories or large companies where corn is a crucial element of their product or business. Thankfully, the weekly Commitment of Traders report can help the average corn futures day trader to understand how the big or smart money is positioned. Released every Friday by the CFTC, the commitment of traders report offers insights into how the large money is positioned, albeit delayed by three days. The report accounts for institutional positioning for the week ending Tuesday with the report released on Friday. The chart below gives a glimpse into how traders can utilize this information to their advantage.

Corn futures speculator and producers-users position (Source Freecotdata.com, CFTC)
In the above chart, the top half shows the price of corn futures while at the bottom, the green and yellow lines indicate the percentile change for the net long and net short positioning between the hedgers (producers and users) and the money managers or the smart money. Typically, hedgers positioning leads the way for corn futures prices. As price rises, hedgers prefer to lock in the price and being selling leading to a net short positioning and vice versa. The money managers or the speculative money typically follows the trends in the commodity.
#7 – Supply and Demand – Impact on corn prices
Supply and demand forms the basis for any commodity. It is simply a reflection of the market dynamics and can significantly influence price of the commodity, corn in this context. Corn futures traders should pay attention to the demand side which can potentially run up or down the price of corn futures. China being the world’s second largest economy and a big emerging market economy can have strong influence on demand for corn futures (both for human consumption and energy demand). The United States is the world’s largest corn exporter but it accounts for less than 15% of the demand. Besides the U.S. other major corn exporting nations include Brazil, Ukraine, Russia, India and South Africa. The demand for corn from China can be volatile and varies from one year to another making it a significant source of uncertainty on the demand side. Still, China does have the influence to impact corn prices. Corn futures traders can keep track of this data by looking for any key releases from China which is often widely reported in the media. The corn futures markets are no doubt an exciting futures commodity that can be traded and day traders in the futures markets can look at making potential gains from trading corn futures contracts. However, there are a lot of factors that one needs to bear in mind such as the time of the year, demand and supply as well as the year’s projection on the corn markets. Take into consideration all the above factors listed in this article to trade corn futures successfully.


 Day Trading
