In this article, I will cover 5 ways to identify that a stock has had a blow-off top.
Because blow-off tops are so violent, it’s best to allow the 5 events I will describe in this article to play out before jumping into the stock.
At the end of this article you will know how to best manage a losing trade if you find yourself trapped in a blow-off top. You will also learn a basic tactic for trading a blow-off top to the long side after the dust has settled.
To assist with this discussion, we will highlight events from XOMA Corporation (XOMA) and Plug Power, Inc. (PLUG) which are two momentum stocks that recently experienced blow-off tops during the spring 2014 pullback.
#1 The Stock has had a massive uptrend with no real pullbacks
The first way to identify a stock is experiencing a blow-off top is to look back at its previous performance leading up to this singular event. There are three commonalities you will find:
- The stock has not had any significant retracements on the way up (>78.6%)
- The stock has had an unimpeded rise for 6 months or more
- The stock has risen on the order of 100% to 500% or more
To see an example of a massive uptrend, please take a look at the stock PLUG below.
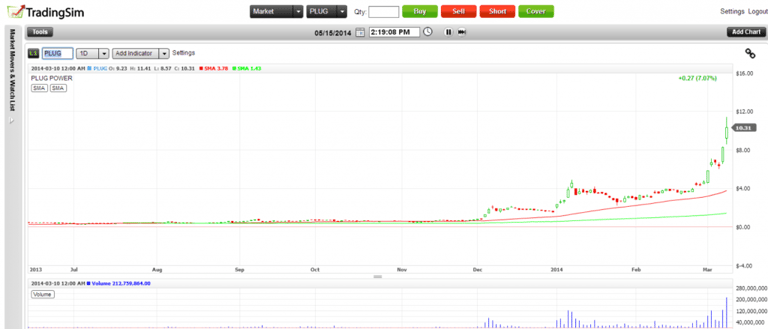
PLUG essentially ran from approximately .60 cents up to a high of $11.41. As you can see in the above chart, the move was very orderly and higher volume accompanied the stock as it climbed further and further into the clouds.
#2 Significant volume on the down move
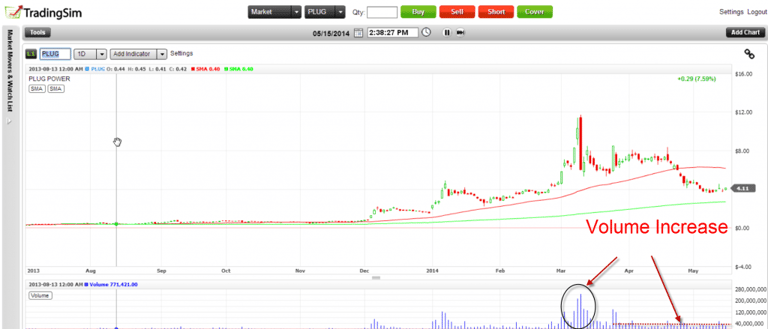
Volume is a key component of identifying a blow-off top. There should be a significant volume increase on the blow-off top day, with more follow-through in terms of volume as the stock plummets back down to Earth.
Looking back at the PLUG example, notice how the volume exploded on the blow-off top day. Also, notice how the average daily volume began to increase as PLUG pulled back to the $3 to $4 dollar range.
#3 The broad market is putting in a minor or major top
This is the magic sauce in a blow-off top. Traders mistakenly see a stock have a 30% to 40% haircut and think that the top is in. Only to see the stock grind higher and make new highs.
The event that truly makes blow-off tops more definitive is when a stock tops out at the same time the broader market is experiencing a minor or major top. To learn more about minor and major tops in the broad market, please check out our article on How to use the NYSE Summation Index as a Trading Guidepost. You will be pleasantly surprised to see how easy it is to identify when a market has reached a point where she needs to take a breather.
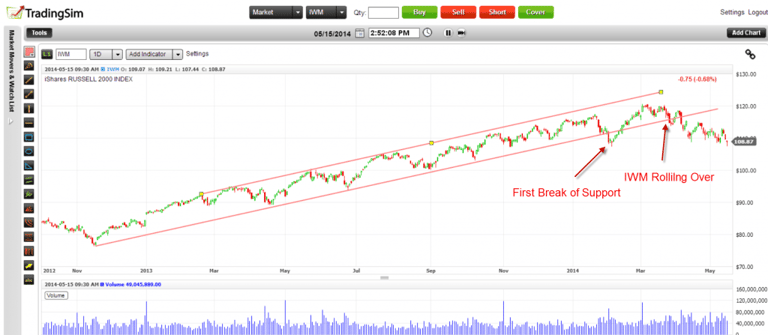
When you look at the iShares Russell 2000 Index Fund (IWM), you will also see a major top was put in for the index. Both PLUG and XOMA are considered momentum stocks and so goes the IWM, so goes the volatile stocks.
Below is a chart of the IWM. Notice how the IWM in early March was experiencing significant weakness after the first break of the trend line back in February 2014.
You could be saying to yourself, “Why does this matter?” If a stock is going to tank, that doesn’t have anything to do with the broad market.
The reason the health of the broad market is important is because weak stocks will only be weaker when the market is going through turmoil. Also, the stock will have to climb a wall of worry when trying to pull itself out of a 50% to 75% pullback.
#4 the pullback from the top is vicious
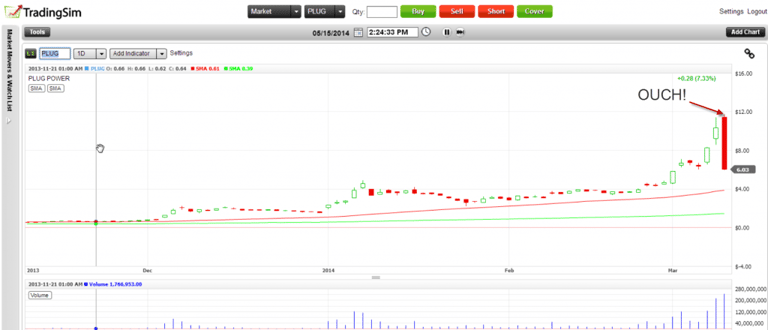
Now that everyone is drinking the Kool-Aid, this is where the first signs of a blow-off top will emerge. Out of nowhere, as the profits appear to be endless, there is a singular event that triggers the selling. This could be a host of things, but the evidence will be overwhelmingly clear on the chart. Going back to PLUG as our example, notice the ugliness of the candle after the swing high of $11.41 was put in the day before.
Let’s look at XOMA for another example of a blow off top.
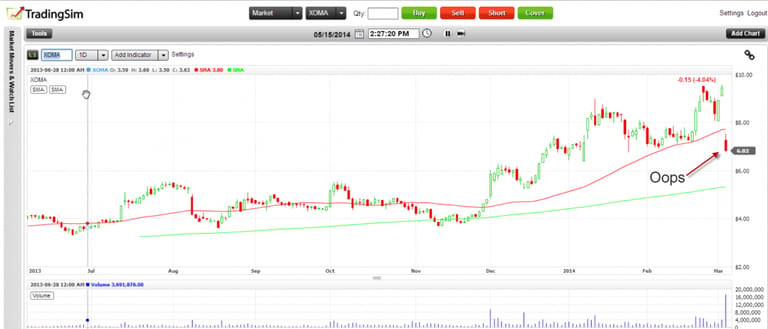
As you can see in the above chart, you would have gone to sleep a king, only to wake up a peasant. The gap down was just breathtaking. Psychologically how does a trader adjust that quickly?
Now the trader could be thinking, well things aren’t that bad, but watch how things unfold for XOMA in a very short time frame.
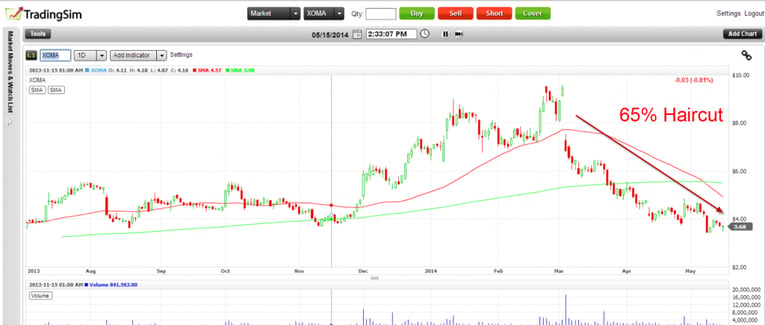
The bottom line is that the move down takes away significant paper profits, to the point that long traders are locked into their losing positions.
#5 Price and Volume on the counter-rally is non-existent
After stocks experience significant sell-offs, the counter-rallies are lackluster. This is where traders begin to loosely throw around terms like “dead cat bounce”. The reason the bounces are short-lived is because the traders who are down in their positions, use the bounce as an opportunity to get out even or slightly down. Short sellers use the bounces as an opportunity to gain better short pricing as the stock climbs. Lastly, long traders that are over-leveraged use the bounces to close out losing positions to reduce the risk of a margin call.
What should you do if you are in a stock that has had a blow-off top?
Now that we have beaten to death what you should look for to identify a blow-off top, let’s now focus on how you can manage that situation.
You Bought the Top
I figured I would highlight this scenario first as it’s the worst position you can find yourself in.
You were totally jazzed about the idea of buying a stock that felt like it could run to the moon.
Now you find yourself down 75% or more. In my humble experience, when you are down this much on a stock, even with a volatile stock, you need to be prepared to hold that position for potentially years before you will see a profit. I know the inclination is to think that the stock shot down so quickly and that this was just a shakeout; however, shakeouts do not violently break 200-day moving averages, retrace 100% or more of up moves and set new multi-year lows. These are characteristics of a flash crash, which is what happened in the spring of 2014.
So, before I go too far off the rails, you really have two options: (1) be mentally prepared to hold the stock for a few years in hopes of turning a profit or (2) use the first bounce to sell out for a loss.
So, the real answer you have to ask yourself is are you good enough that if you were to get back say 70% of your money, can you make up the 30% you loss over 1 or maybe 2 years? If the answer to this is yes, then you will get a better rate of return on your cash by taking the loss and moving on to find more profitable trades.
If you feel that your trading skills are not there and you are just prone to more bad trades, it could be best to sit through the correction and wait for your stock to consolidate and make another run at the highs. This approach in my opinion can be more risky depending on the volatility of the stock as you may have to wait a long time and still may not make your money back.
This is why we trade. There is risk and opportunity at every corner and you must manage your account through these good and rough times.
You Bought After the Crash
You managed to nail the perfect buy point after the sell-off. You will feel a since of invincibility as the market climbs with ease and the profits appear to be never ending. You will feel the urge to hold on for a new high, but trust me my friend, it’s not coming. The best thing you can do is to close your position out once you approach the 50% to 78.6% retracement levels.
In Summary
If you can identify blow-off tops you can better protect your capital and with the right level of skills, profit from the overreaction of other traders.
Another Blow-Off Top Example for the road
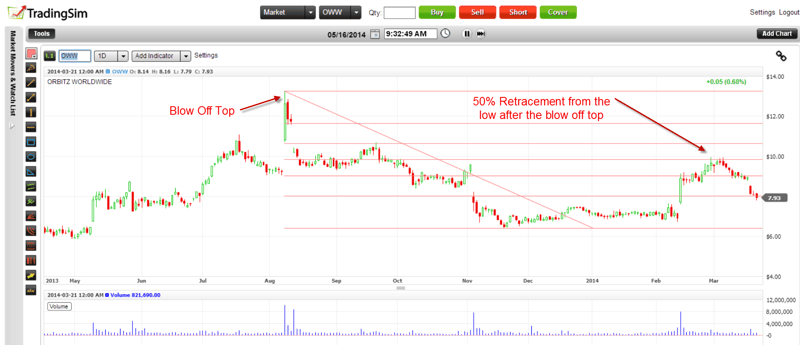
Below is another example of a blow-off top for the stock OWW.
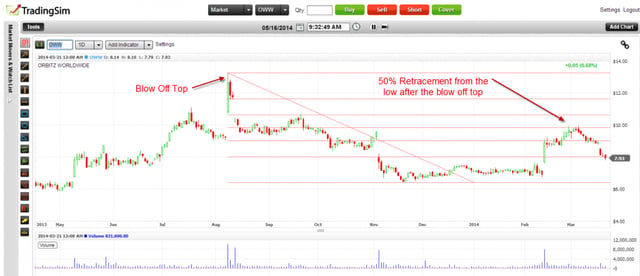
If you are trading momentum stocks, a.k.a high volatility stocks, you will easily make 20% to 50% on the bounce move.



 Volume Indicators
