For traders looking at consistency and profits, there is nothing better than trading gold futures. Of course, e-mini S&P500 does come in close competition, but if you compare the price action between gold and the S&P500, trading gold futures wins hands down although it can be a bit expensive to trade gold. However, in terms of the intraday volatility and the subsequent potential to make profits, trading gold futures can be a profitable way to trade.
While there are many different trading strategies available out there, as a futures trader it is important to understand the distinction between swing trading (long term) and intraday trading (short term). Both these approaches have their own pros and cons.
With long term swing trading in gold futures, you will firstly be required to have adequate margin available in your account. Sometimes gold futures tend to gap higher or lower and this can significantly eat into your margins. Also, the problem with trading long term is that sometimes it takes weeks for price to reach its objective, meaning that your trade is likely to initially move into profit and only to move back into the negative. The wild swings require a lot of patience and a focus on your margins.
On the contrary, intraday trading in gold futures, if done right has its own benefits. For starters, you focus is the short term markets. Thus pocketing $5 – $10 per week trading gold futures could translate to $500 – $1000 in profits. You also don’t need to have significant capital as well, as a $10,000 in trading capital can more than suffice to take advantage of the intraday volatility in gold futures markets.
Gold Futures Contract Specifications
Before we get into the details, it is absolutely essential to once again run through the contract specifications and margin requirements for gold futures. While this has been covered in the past, the reason for repeating this again is to ensure that even before you trade gold futures, you need to know the contract specifications and margin requirements and other technical details of the contracts by heart.
| Ticker |
Units |
Tick Value |
Min. Tick |
Per $1 move (10 points) |
| GC (Standard gold) |
100 troy ounces |
$0.10 |
0.10 |
$100 ($10) |
There are many other versions of gold futures contracts including mini sized gold contracts and micro-sized gold contracts. While they definitely require lower margins, the tick size also varies. However, volume of trading in those contracts is essential. By far the standard gold futures contracts (GC) is the most popular and well know among the different variations.
5 Tips for Day Trading Gold Futures
Now that you have the contract specifications for trading gold futures, here are 5 trading tips for gold futures markets.
#1 – Gold futures price correlation
Correlation is an important tool for traders in general. Correlation offers the advantage of being ‘doubly sure’ of your trade bias. What better way than to have two separate assets that are highly correlated that can confirm your bias?
Gold is highly correlated to yen as both these assets fall into the category of ‘safe haven instruments.’ Because of this correlation, gold and yen futures tend to move in the same direction. The market sentiment plays a big role in gold and yen futures. The general principle being that when investors’ appetite for risk increases, then the preference to hold safe haven instrument drops as a result. Likewise, when the risk appetite wanes, investors tend to flock to the safe haven instruments, which appreciates as a result.
The chart below shows gold futures (GC) and yen futures (J6) and it is not hard to see how these two assets tend to be closely correlated.
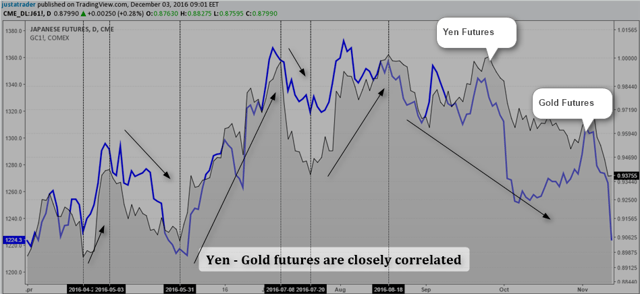
Gold – Yen Correlation
If you want to be even more thorough, you could also look at the Dollar index futures for additional confirmation. However, this is not required as the dollar is the de-facto common currency between gold and yen futures.
How can you use this information?
When you are trading gold futures, no matter what strategy you use, you can always check the same with yen futures as well. More than 80% of the time you can validate your trade set ups by comparing the two futures instruments.
The next chart below shows a 1-hour time frame for gold and yen futures. Notice the inside bar formed on the yen futures, followed by a lower high. At the same time, on the gold futures, a few sessions later, an inside bar was formed followed by a lower high and then price fell by $4.00.
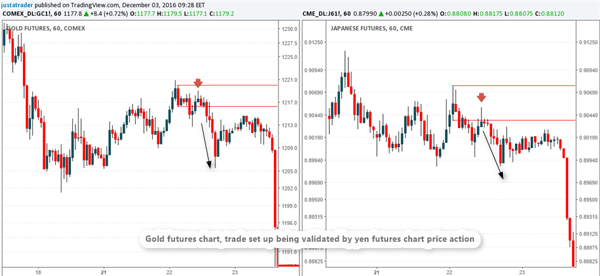
Trading Gold Futures Using Yen Futures Chart
#2 – Gold futures daily chart analysis for intraday set ups
One of the simplest ways is to look at both the charts on a daily or weekly time frame to being with. This helps you to ascertain the long term trend. You can then switch to a 1 hour or 15 minute chart and buy the pullbacks (dips in an uptrend) or (rallies in a downtrend) on the lower time frame charts. This method works at the start of a new trend and as the trend progresses; prices are more susceptible to deeper pullbacks.
The next chart below illustrates how you can apply the daily chart’s price action to the lower time frame. On the right side of the chart you can see a doji forming near the bottom end of the trend. This was followed by a bullish close above the doji’s high at 1075.2.
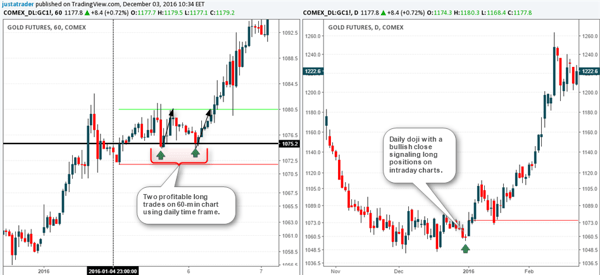
Gold Futures – Multiple Time Frames
Marking this level on the 1-hour chart, the trade idea is to simply buy the pullback to 1075.20. On the 1-hour you can also see that the previous high or resistance was found at 1080.50. We had two profitable trades here from going long at 1075.20, targeting 1080.5 with stops at 1071.90. These two trades would have come to a reward of $5.3 with a risk of $3.3. If you were only trading one contract of gold futures (GC), that would have resulted in $530 in profit, or in total $1060.
How can you use this information?
Multi time frame analysis can scare off a few traders, but it is relatively simple. Look to the daily chart and ascertain at what stage the trend is in. This can be done by scrutinizing the highs and lows and then plotting key highs and lows.
Once the levels are plotted, look at how price forms near these levels on the daily chart and based on the trading bias (long or short) you can then look to the smaller time frames such as 60 minute or 30-minute and trade based off the support and resistance levels. It takes a bit of experience to be comfortable with this approach to day trading gold futures charts but it can be learned quickly and can be profitable, especially if you have a good risk/reward set up in each of the trade set ups.
#3 – Trading 5-minute chart patterns on Gold futures
The 5-minute chart time frame can be very useful to capture short term profitable trades for an average of $5 – $10 on a daily basis. On a per contract basis, this translates to $500 – $1000 in profits. The benefits of trading 5-minute chart timeframe is that, while you can maintain your profit target of $5 – $10 on average, you can move your stop loss to break-even after a $2 move in price. This way, the $2 move in price, which equates to $200 in a standard contract can cover the costs of your trade and leave you with a profit even if price reverses without reaching the full target.
Price patterns are one of the easiest ways to get started. To remove any scope of subjectivity, simply look at round numbers.
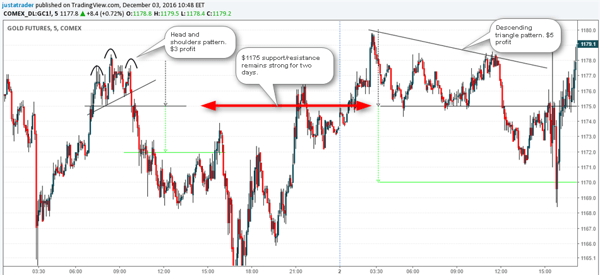
Trading Chart Patterns on Gold Futures 5 Minute Chart
The above chart shows the head and shoulders pattern and then the descending triangle pattern the next day. Notice how $1175 remains the key support/resistance level in both these trade set ups. An important aspect to bear in mind when trading chart patterns on the 5-minute time frame for gold futures is that instead of looking at the two decimals, simply use a round number such as $1100, $1101…. $1175 and so on. This gives you a better grip on the support and resistance levels where prices can show the potential to reverse.
#4 – Capturing healthy trends using 5-minute gold futures chart
For traders who prefer a non-discretionary approach to day trading gold futures, the 20/50 EMA + Stochs method can offer a way out to capture healthy trends. This method has minimal check lists and offers tight risk reward set ups.
Simply add a 20 and 50 period exponential moving average with a 14,3,3 full Stochastics oscillator on the chart. Mark the levels where the EMA’s make a bullish or bearish crossover and wait for price to retest this level. When price retests, look for the EMA’s to be still bullish (or bearish) and look for the Stochastics to be oversold (or overbought). You can go long or short once the Stochastics moves above 20 (or below 80) with stops at the recently made swing low (or swing high).
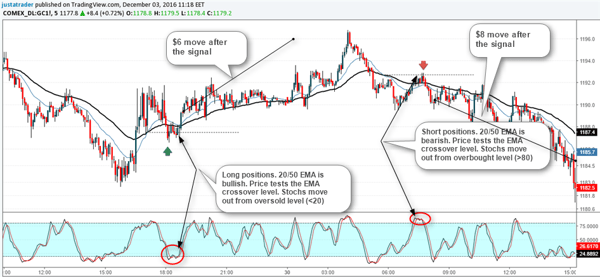
20, 50 EMA + Stochastics on a 5 Minute Gold Futures Chart
The chart above shows two profitable trades with perfect trade set up conditions. In the case of the long position, it resulted in a $6 move in prices after the signal was triggered. That’s about $600 in profit intraday. On the right side, a short position is triggered which resulted in more than $8 move in prices, which is about $800 in profit on the short position, again within a few hours time.
#5 – 30-minute gold futures momentum trade
In the gold futures momentum method, we only look at price action that shows strong momentum (bearish or bullish). There should be a minimum of three candlesticks exhibiting strong momentum with the last candle being breached by 50%. Meaning that the final candlestick must be followed by an opposite direction candlestick that closes 50% above the high/low range.
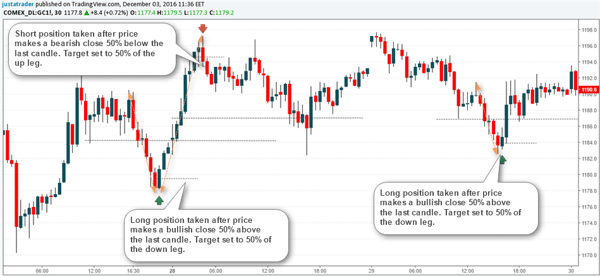
30-Minute Chart, Gold Futures Momentum Trade
The chart above has three examples. In the first case, after a strong decline of nearly $12, price makes a bullish close 50% above the final bearish candle. A long position here is taken, targeting 50% of the bearish short term trend. Similar examples are seen in the remaining two set ups where after the strong uptrend price breaches the final bullish candlestick by 50% with a bearish close, triggering a short set up and so on.
The momentum trade set ups for gold futures is another way to trade strong price action. However, bear in mind that these set ups do not happen all the time and therefore you need to be patient in waiting for the right environment to form before you can enter a trade.
Making profits with gold futures day trading
With the right mindset and discipline, traders can ignore all the other markets and just trade gold futures on an intraday basis. With the standard gold contracts offering a reasonable price per tick, with due practice, traders can easily reach a goal of making at least $500 in profits just by trading gold futures. Many traders tend to fall prey to greed and end up over-trading. While it seems difficult to restrain one self, it will only take a few days to get used to the idea of day trading gold futures and closing out your trading terminal once your daily goal is reached. Remember that the markets will offer you plenty of opportunities to trade. With the right mindset, and following any of the trading methods outlined in this article, you can certainly look at making consistent and profitable trades with gold futures.


 Commodity Futures
