Arnaud Legoux moving average or ALMA for short is a recent addition to the family of moving average technical indicators. Developed by Arnaud Legoux and Dimitrios Kouzis Loukas, the ALMA was created as recently as 2009. Despite being new, the ALMA has quickly caught on to the trading community. The fact that the ALMA is based on the moving average indicator makes it universally acceptable, across different markets and different time frames.
The Arnaud Legoux’s version of moving average technical indicator was designed to address two common drawbacks with the traditional moving averages, responsiveness and smoothness. Anyone who has used a moving average would know that a short term moving average is more responsive, but comes at the risk of being choppy and can result in false signals. On the other hand, a longer term moving average is known to be smoother, but lacks in terms of responsiveness, meaning that price already makes a significant move before the longer term (smoother) moving average catches on.
So traders are generally caught between a fast and responsive but prone to false signals moving average, or bear with the long term smoother moving average which is often delayed when it comes to signals.
Technical traders have over the years tried to overcome this method, which is one of the reasons why you find quite a few two moving average strategies, where you essentially have a short term and long term moving average, thus looking to trade based off responsiveness and smoothness. For example, a 50 and 100 day EMA applied to the charts and so on.
The Arnaud Legoux moving average attempts to bridge this gap and thus is expected to show both responsiveness and smoothness at the same time. Interestingly, the Arnaud Legoux moving average applies the moving average twice, once from left to right and the other from right from left with the process said to eliminate price lag or phase shift significantly, a problem that is common to the traditional moving averages.

EMA and ALMA comparison
The above chart shows a comparison between the traditional 50-period exponential moving average (yellow) and the 50 period ALMA (black) applied to closing prices on the price chart. You can see how the Arnaud Legoux moving average offers a mix of both responsiveness and smoothness at the same time. In most cases in the above example you can see how price interacts first with the ALMA than the exponential moving average.
The Arnaud Legoux Moving Average settings
Compared to the traditional moving averages, the Arnaud Legoux moving average has some additional settings. Here is a brief breakdown of the parameters.
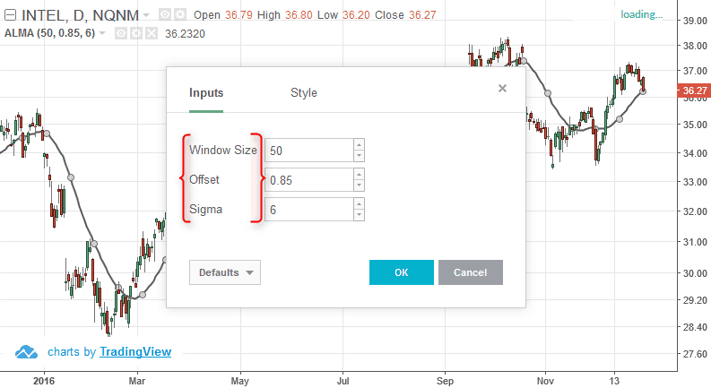
Arnaud Legoux moving average parameters
Window size: The Window Size is nothing but the look back period and this forms the basis of your ALMA settings. You can use the ALMA window size to any value that you like, although it is best to stick with the well followed parameters such as 200, 100, 50, 20, 30 and so on based on the time frame of your choosing.
Offset: The offset value is used to tweak the ALMA to be more inclined towards responsiveness or smoothness. The offset can be set in decimals between 0 and 1. A setting of 0.99 makes the ALMA extremely responsive, while a value of 0.01 makes it very smooth.
Sigma: The sigma setting is a parameter used for the filter. A setting of 6 makes the filter rather large while a smaller sigma setting makes it more focused. According to Mr. Legoux, a sigma value of 6 is said to offer good performance.
The picture below shows the parameters and how they all fit in within the Arnaud Legoux moving average formula.
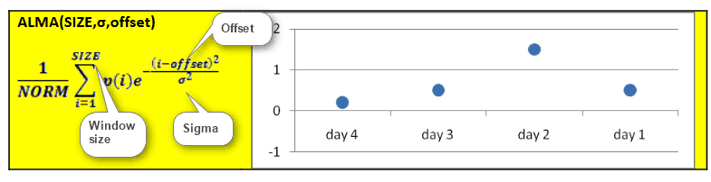
Arnaud Legoux moving average formula
Now that we have an understanding of the Arnaud Legoux moving average, there are five strategies that you can use or apply to your own existing trading strategies using the ALMA indicator.

1. Trading with the trend using ALMA
Given the fact that the ALMA is more efficient compared to the regular moving averages and the fact that it is nothing but a trend indicator, the simplest way to use the Arnaud Legoux moving average is to apply it as a trend line indicator. Uptrend is formed when price is trading above the ALMA and a downtrend is seen when price is trading below the ALMA. Additionally, we also make use of the Stochastics oscillator with a setting of 14, 3, 3, and use this to identify oversold and overbought levels within a trend. The overbought and oversold levels are between 20 – 30 and 70 – 80.
In this trading set up, the rules are quite simple. Buy when the Stochastics oscillator is oversold in an uptrend and sell when the Stochastics oscillator is overbought in a downtrend.
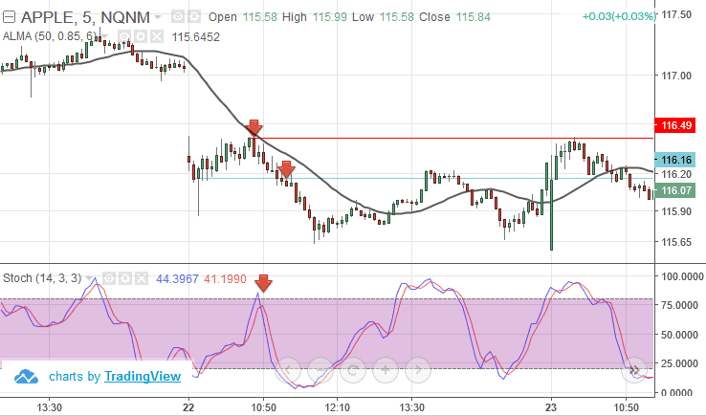
ALMA – Trend Following (Sell signal)
The chart above shows a nearly perfect sell signal as price is below the ALMA indicating a downtrend and the Stochastics briefly pulls up close to the overbought level and then falls.
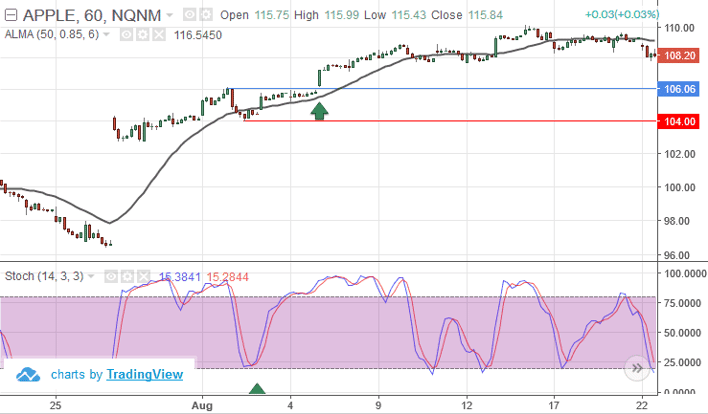
ALMA- Trend following (Buy Signal)
The next chart above shows a buy signal. Here you can see how price dips just a few cents below the ALMA but with the Stochastics in the oversold zone, price quickly starts to reverse and pushes high.
1. Using EMA Buy/Sell Signals
Another simple approach to trading with the Arnaud Legoux Moving average is to make use of two exponential moving averages added on top of the ALMA indicator. Here, the ALMA (50 period) acts as the main trend filter, meaning that long positions are taken above the ALMA and short positions are taken below the ALMA. The 5 and 10 period exponential moving averages are added on the chart to give early signals to the trend.
Therefore, when the 5/10 EMA triggers a bullish crossover, long signals are taken when price is above the ALMA, likewise, when the 5/10 EMA triggers a bearish crossover, short signals are taken when price is below the ALMA.
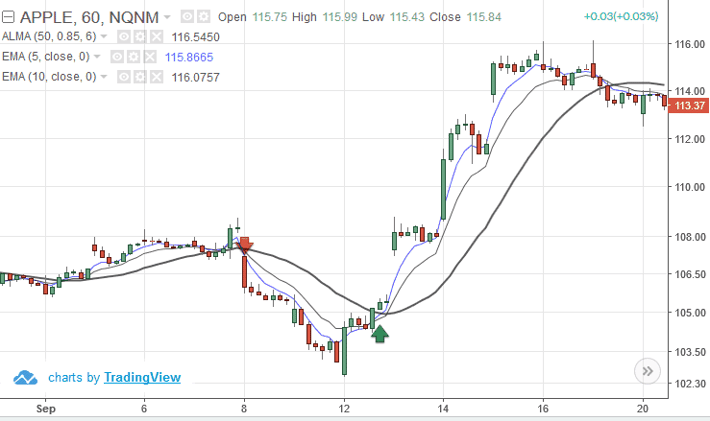
Trading with ALMA and 5,10 EMA
The above chart shows the 5/10 exponential moving average added to the chart with the 50 period ALMA acting as the trend filter. There are two signals shows in the above chart with the arrows marking the entry point after price closes above or below the ALMA. This is a very simple and an open-ended system and traders can further make use of their own methods such as using Parabolic SAR or other indicators to lock in profits at regular intervals.
3. Buy/Sell with two Arnaud Legoux moving average
What do you get when you trade with two ALMA’s? Smooth trends filter with buy and sell signals. Given the fact the Arnaud Legoux moving average combines both smoothness and responsiveness, the bullish and bearish moving average crossovers can be an effective and simple way to day trade.
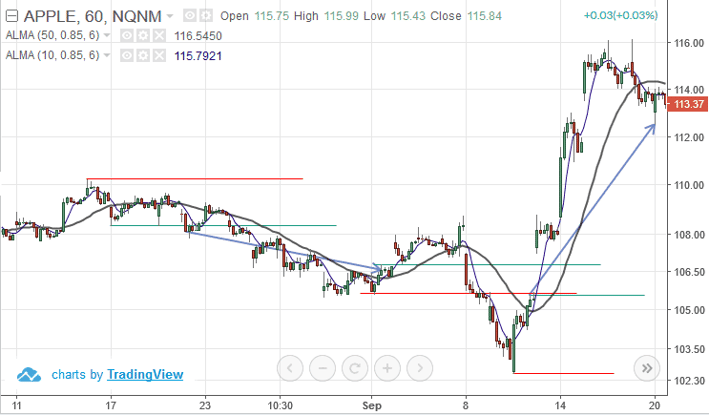
Arnaud Legoux moving average crossover signals
The above chart shows 50 period and 10 period Arnaud Legoux moving averages with the same sigma and offset values. Looking at the peaks and troughs that are formed during the two ALMA crossovers, we can see examples of buy and sell signals. With good money management and booking partial profits, trades can be locked in with frequent profit taking in this rather simple day trading strategy.
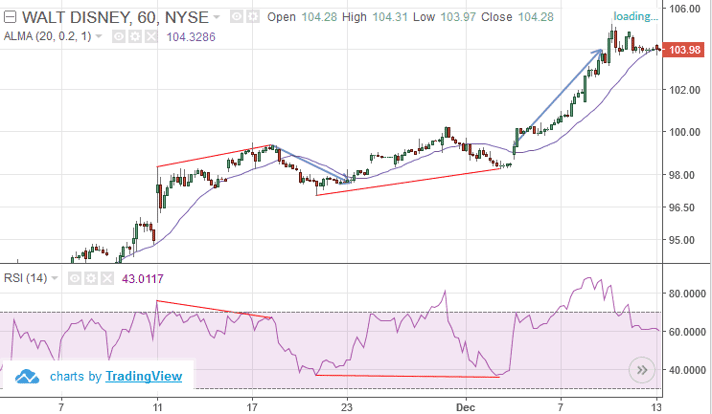
4. Trend and Parabolic SAR
Using the Arnaud Legoux moving average as a trend filter, long and short signals are taken with a trailing stop being employed making use of the Parabolic SAR indicator. The chart below shows two examples of short and long signals generated. In the first short signal example, after price closes below the ALMA and the parabolic SAR plots above the price high, sell signal is opened with the stops trailed to the PSAR values until the trade is stopped out.
Parabolic SAR and ALMA trend filter
Similarly, you can see a long position where price cuts above the ALMA and the Parabolic SAR plots below the price low. Using these values as the trailing stop levels, we can stay long into the trade until the trade is stopped out.
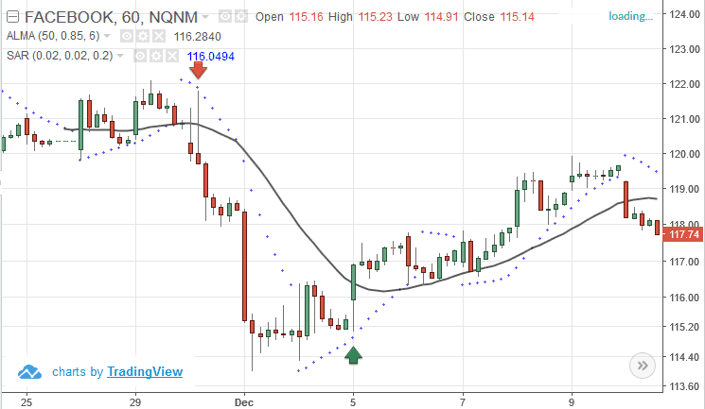
5. Trading divergence with ALMA
Another way to day trade with the Arnaud Legoux Moving average is to make use of an oscillator to spot divergences. The chart below shows two examples where we make use of the 14 period Relative Strength Index and the Arnaud Legoux moving average.
In this day trading strategy, divergence forms the initial basis of the trade set up with the ALMA then acting as a trigger. The first short signal is identified when price makes a higher high but the Relative Strength Index plots a lower high. This bearish divergence is later confirmed when price closes below the ALMA, thus triggering a short trade.
The short trade is then exited when price closes above the ALMA. A few bars later, we can see price making a hidden bullish divergence with the higher low in price reflecting in a lower high in price. Once the divergence is formed, we then take a long position after price breaks above the 20 period ALMA indicator.
The stops are trailed either at the ALMA values or using an ATR or the parabolic SAR indicator and the trailing stops are moved until the trade is stopped out with a profit.
Trading divergence with ALMA
In conclusion, the above five day trading strategies make use of the Arnaud Legoux moving average which forms the central theme to the trading strategies mentioned. The ALMA is an interesting moving average indicator that claims to bring a balance to responsiveness of the indicator to price while being smooth at the same time, a factor that has hitherto remained elusive to most other forms of moving averages.
With moving averages being one of the most central of indicators when it comes to trend following, the improvement in the responsiveness and smoothness offered by the Arnaud Legoux moving average no doubt offers a better way to trade the markets.
The ALMA can be applied to just about any trend or counter-trend following trading strategy and can even replace existing trading strategies that make use of the simple or exponential moving averages. With only three parameters to change, the ALMA can be tweaked for each market to aptly capture the volatility and allow for a better way to trade the market trends.


 Candlesticks


