A thinly traded stock or a low volume stock is often defined a stock that has low trading volume. By way of looking at a stock’s market capitalization, thinly traded stocks are ones that are quite likely lower than the small cap stocks. The definition of a thinly traded stock can vary depending on who you ask and is also a matter of one’s perception.
According to Susan Wyderko, a former SEC director of investor education, but she gives a rough estimate as noting that small companies that have $10 million or less in assets or have 500 or less investors would qualify as a thinly traded stock.
Another expert says that market capitalization is not the right indicator and says that a good definition of a thinly traded stock is one that trades 20,000 shares on average a day, regardless of whether the company is a large cap or a small cap. There are many other definitions as well including looking at other factors such as the spread with a spread of $0.50 as one of the filters to look for alongside the other definitions of a thinly traded stock. While it is evident that there are different explanations for what a thinly traded stock is, it would be safe to combine the above as a set of rules in determining what qualifies a thinly traded stock.
Thus, to summarize what defines a thinly traded stock we have the following rules:
- A stock with $10 million or less in assets
- Having less than 500 investors
- Trades less than 20,000 shares a day on average (Average trading volume)
- Spread no more than $0.50
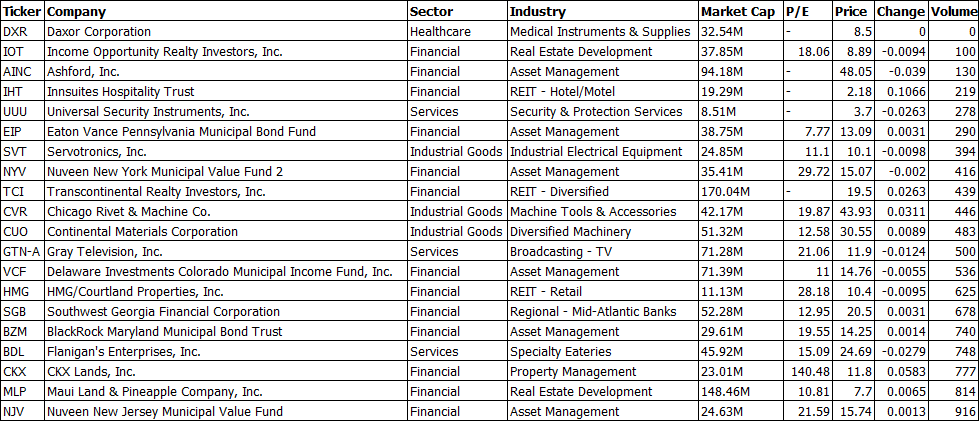
Example of some thinly traded stocks, with volume less thn 1000 (Source – Finviz.com)
The above table shows an example of some of the thinly traded stock with volumes of less than 1000. Needless to say, trading such stocks comes with significant risks. Let’s take a look at a random stock from the list to see how the price chart looks like.
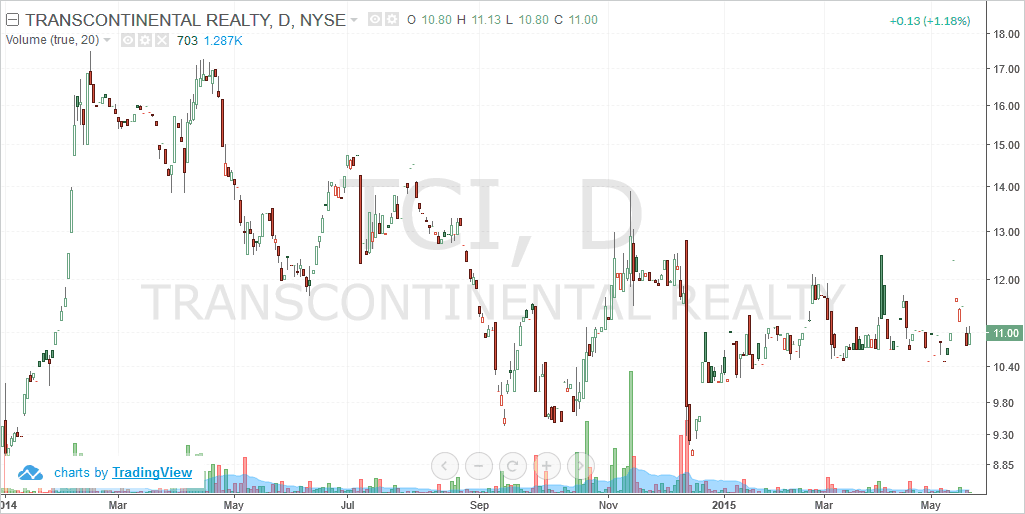
Transcontinental Realty (NYSE – TCI)
The above chart shows the stock chart for Transcontinental realty, a NYSE listed stock. You can see how the trading volumes started to decline since May 2014 and falling to less than 100 by the start of 2015. One of the main impact low volume has on a stock is that the price can be erratic. On closer observation, you can see instances where a volume of 400 managed to push price from $11.00 to $12.41, which is approximately a 12% jump on just 400 shares.
One of the biggest issues with trading thinly traded stocks is the intention to buy. For example, if you want to invest $5000 of your capital by purchasing some stocks, this isn’t an issue when a company is trading $100,000 or more in value on average on a daily basis. Howeve, if the company trades just $2000 in value per day, investing $5000 in such a company can lead to erratic price movements. In some cases, the existence of such orders is more than enough to drive up prices quickly with no apparent fundamental reason to back up such moves. It simply puts the uninformed trader at a great risk.
The reason why thinly traded stocks are often shunned is because on one side, institutional traders do not look at stocks that does not trade a minimum of one million or more in value. On the other hand, analysts who continuously keep a track on stocks do not look at such stocks because just a handful of buyers can quickly push the stock price higher.
The chart below shows a comparison of a thinly traded stock compared to the volumes of Alphabet Inc. (GOOG).
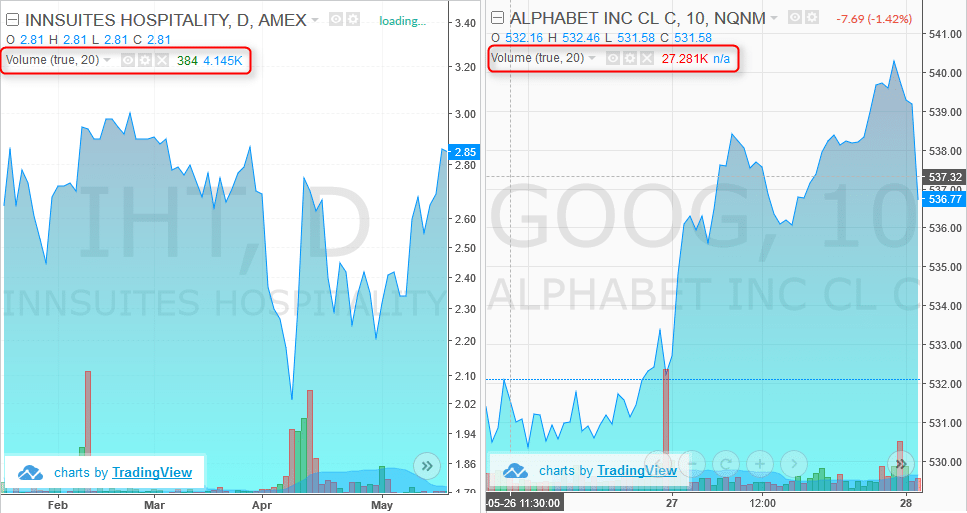
Volume Comparison 384 shares vs. 27.291k
Why do stock traders bother with trading volume?
Trading volume as we learned above reflects the activity or interest in the stock. Volume indicates the amount of buying and selling activity that is taking place in the stock or the security. Some go as far as to call volume as the second most important variable after price.
Trading volume represents the total number of shares that are changing hands during a given session. Volume, is not just limited to stocks but to just about any instrument or security as long as it is cleared at an exchange. So this includes, futures, options besides stocks.
As part of the regulation, trading exchanges are required to report on the daily trading volume for each of the securities that are listed on the exchange and are being executed. The trading volume indicates how liquid a stock or a security is.
Trading volume is viewed by some as a reflection of price, which is nothing but the value given a stock by the investors. When not enough securities change hands, it results in low volume. When volumes are low, the price of the securities hardly move, therefore making trading very difficult. However, when there is a lot of buying and selling acitivity in the stocks, price of the security can turn volatile, moving up or down and allows for investors of all kinds to make profits on the stock. The importance of volume comes from the fact that many technical analysts and to some extent, stock analyst,s look at volume as a gauge of interest in the security and therefore is it generally accepted that low volume stocks have little to no interest among the majority of the investing community.
It is broadly understood that when trading volumes rise, it reflects increase in the security and thus can send prices surging higher or falling sharply. Volume is sometimes refered to as a measure of momentum. Low volumes, even in a liquid security indicates lack of trader or investor conviction. This is typically found when prices are rising sharply but volume is declining, a tell-tale sign that the stock price is about to crash.
The important of trading volume is best seen among day traders who subsribe to the technical analysis school of thought. For such traders, volume is an important aspect in determining whether to buy or sell a stock. For example, stocks with a breakout accompanied high volume is a safe bet compared to buying a stock that breaks out with low volume.
You can see by now how volume plays a significant role among day traders and technical analysts.
What are the challenges associated with thinly traded stocks
Interestingly, some of the things taken for granted when trading regular stocks are the very things that can be the difference between determining the success or failure in your trading. Here are some of the risks and challenges that are most commonly associated with trading low volume stocks.
1. Low volume stocks can be susceptible to manipulation
When a security is not liquid enough to absorb the shocks in terms of buying and selling pressure, investors can be at risk of losing their investments. A low volume stock along with the stock’s price can be susceptible to dumping of shares. As an example, assume a stock’s share price is $5 and has an average trading volume of 1000 shares a day. Now, if someone bought 2000 shares for a price of just $10,000 it would greatly influence the stock’s price and push prices higher. You can see how trading low volume stocks can be a risky affair as just one order simply doubles the average trading volume putting other investors at risk especially if they are caught on the wrong side.
2. Low volume stocks have wider spreads
A spread is defined as the difference between the price at what you buy a stock and the price at what you sell a stock, known as the bid and the ask. While there is no strict criteria as to what the ideal spread should be, the widely accepted notion is that stocks with a spread of more than $0.50 are best to avoid. This combined with low volumes can be a sure way to determine a low volume stock.
Because the stock has very little interest among investors, when you buy a low volume stock and you want to sell it, because of lack of investor interest, you might get a bad fill on your price. Going back to the prvious stock in our example, Transcontinental Realty, you can see the spread of $0.50. This means that you can buy TCI at $11.25 and you can sell at $10.75.
In contrast, the spread for well known stocks as AAPL,GOOG, FB and so on are on average $0.05 with some of the stocks having a spread of just 1 cent.
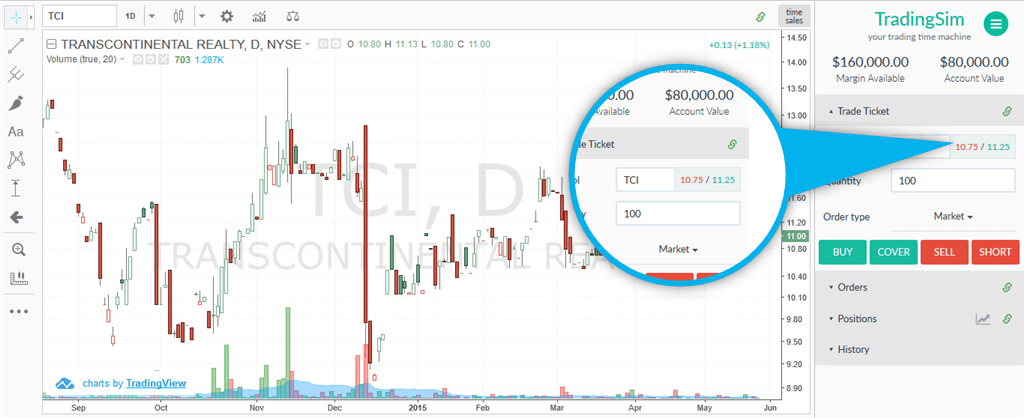
(NYSE-TCI) Bid-Ask Prices
3. You just cannot day trade a thinly traded stock
As with the same reason, low volumes mean that a stock’s price can be stuck for prolonged periods of time, making day trading virtually impossible and frustrating. And even if you want to day trade such stocks, you have to be very careful in selecting the right stocks.
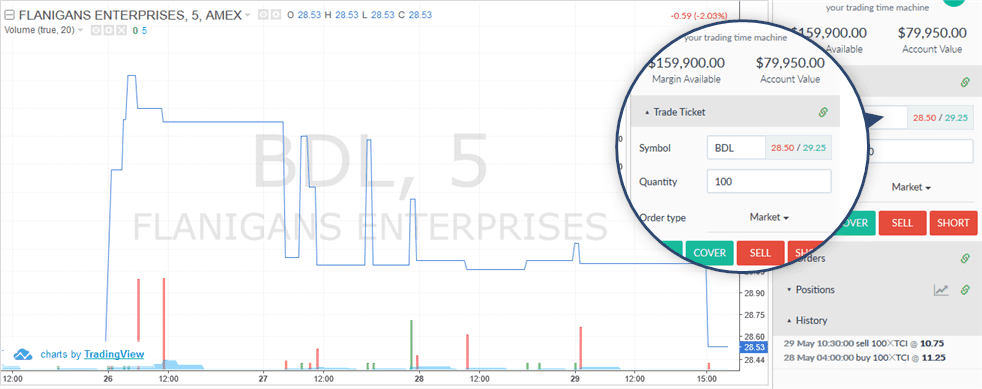
(NYSE – BDI) Intraday chart + spread
The above chart is the intraday stock chart for Flaniigans Enterprises (BDI). You can see the closing line chart for the 5-minute time frame. For nearly two days since 28 May 2015, price of BDI barely budged from the $29.05 price. Imagine being caught in a day trading position when the trade hasn’t moved a bit. Furthermore, if you look at the spread, that’s about $0.75, meaning that if you made the mistake of going long in BDI and hoping to exit for a few cents, the $0.75 spread makes it even more difficult to think of making any decent gains from this stock’s day trading position.
4. Bad fills make it risky to own a thinly traded stock
One of the general arguments in favor of trading thinly traded stocks is that they have strong appreciation in the short term. That maybe true as you can find some thin volume stocks where price can surge by nearly 40% in just a quarter and the returns can be big. But the lure of this quick short term appreciation comes at a cost, which is the risk of a bad fill in case volume dies down again. One of the main reasons the thinly traded stocks tend to appreciate strongly is the sudden interest in trading volume. A couple of large orders can quickly push prices higher, which could potentially attract gullible investors into buying into this short term rally in hopes of further appreciation in prices.
However, once this wave of buying subsides and the volume dries out, the stock once again turns flat. What’s even more painful is that to offload your stocks, you will either have to wait for the stock to hit the right price or offload your stocks at the market value, which when combined with the spread can east significantly into your profits. Further more, the short term duration of trading such stocks means a different tax bracket, all of which eventually leads to realizing smaller than expected profits.
5. Thinly traded stocks are volatile bets
There are a lot of arguments that go in favor of trading thin stocks such as prices trading at a discount or the strong short term appreciation in the returns. While it is true that low volume stocks can often generate surprisingly positive results and big returns in some cases, they come at a significant risk especially if the investor does not have enough experience or knowledge in dealing with such type of stocks. Secondly and most important is the fact that it is highly difficult to day trade thinly traded stocks, leaving most of the trading to medium – long term investors only.
For long term investors, it will take a lot of conviction and test of their valuation and analytical skills to hold on a low volume stock especially when the prices are volatile.
In conclusion, trading low volume or thinly traded stocks is a risky proposition. Although investing is generally risky, this increases exponentially when trading illiquid stocks. Due to the nature of the stocks and low volumes, the thinly traded stocks can be easily cornered and can be manipulated with relative ease. Furthermore, the transparency in terms of reporting the balance sheets and other accounting practices are less stringent, making such stocks easily vulnerable to manipulation.
While thinly traded shares are risky, they can reward the trader who is patient and diligent in picking the right stocks.


 Day Trading Basics


