Fans of the Tradingsim blog know that I am big on volume. Volume is probably one of the oldest off chart technical indicators you will find in technical analysis. So, as I’m looking through the technical indicators I have been intrigued by the possible uses of the volume oscillator indicator.
The volume oscillator displays the relative strength of a shorter volume moving average to a longer one. To keep things super simple, whenever there is a positive reading for the volume oscillator, there is strength on the short-term in the direction of the primary trend. If the volume oscillator is in the negative territory, volume is lacking and a change in trend is likely.
In this article, I will cover 4 strategies for how to trade with the volume oscillator. If you are looking for how to calculate the volume oscillator and more of a technical definition of the indicator, please visit the TA-Guru.
From a guy that believes that volume is the key to identifying the strength of a trend and where the smart money is placing their bets, the volume oscillator provides an interesting perspective for how to view market activity.
We all have seen the volume bars at the bottom of the chart which shows trading activity like the chart below:
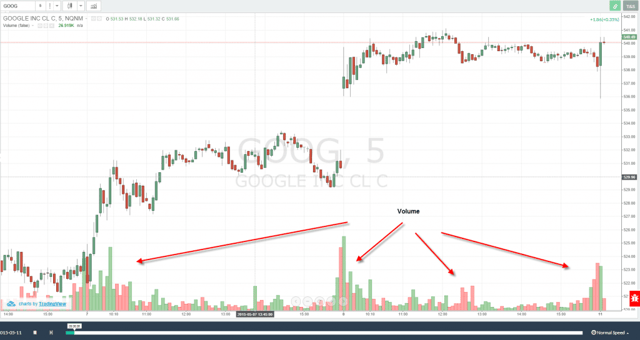
Volume Example
As a trader, you will look for when volume is drying up and when volume is accelerating. The red and green volume bars provide us an indication of how the price closed. Nevertheless, what is the volume actually telling you about the future direction of the trend?
Depending on the trade setup and volume at previous peaks or troughs, the market could be sending you a number of signals.
Interpreting these signals is where the volume oscillator can provide clarity on where the stock could be headed.
In the following examples, I will be using 5 periods for the short-term and 10 periods for the long-term, as these are the defaults in the Tradingsim platform.
#1 – Breakout Confirmation
Breakouts have a high failure rate in the market, because these are levels, which are very visible to all traders. There isn’t some mystical Fibonacci level or complicated trendline; it comes down to a break of a recent high or low. Let’s take a look at a few breakout examples and the corresponding readings of the volume oscillator.
Apple Breakout
The first example is of a breakdown of Apple on a 5-minute chart. Notice how as Apple approaches the previous swing low, the volume oscillator spikes higher.
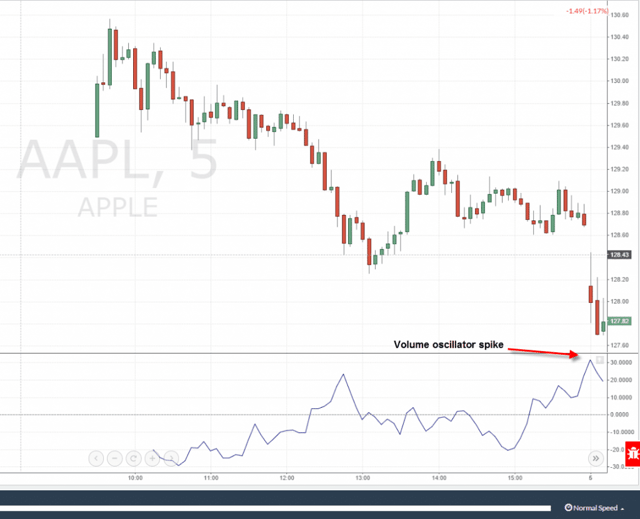
Volume Oscillator Spike
The previous swing low had a volume oscillator spike in the neighborhood of 23.42, while this break had a reading of 31.74. So, does this guarantee the price will continue lower? Absolutely, not!
The way you should interpret this is that the amount of selling pressure increased on the retest of the swing low. At this point, one of two things can happen: (1) Apple would reverse sharply as a selling spike could lead to a trend reversal or (2) Apple will continue lower as the bears are in control.
Let’s fast forward in time to see how the action played out for Apple.
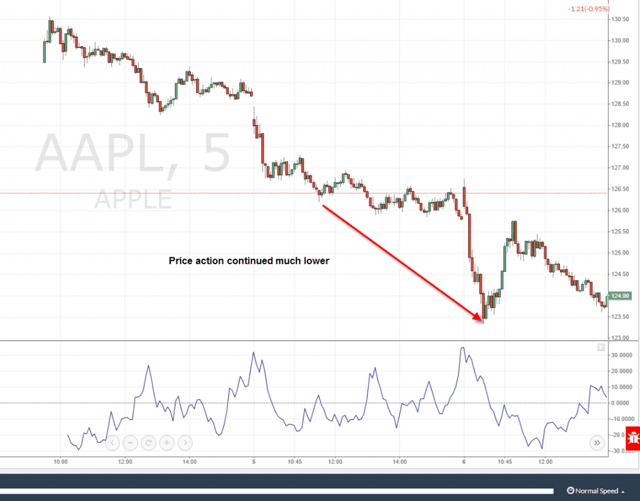
Apple Much Lower
Now that we have shown the happy path, let’s dig into an example where the volume oscillator failed.
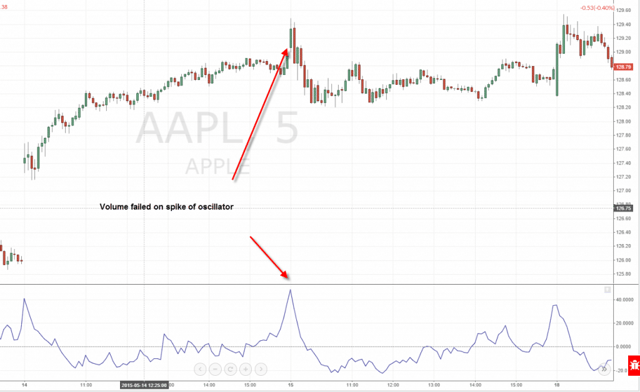
Volume Oscillator False Signal
On this breakout, Apple had a nice spike in the volume oscillator on the positive side, which should have resulted in a continuation of the breakout. However, as you look at the chart, you will notice that Apple actually reversed at this critical level and generated a bull trap.
How could you have known that the signal was false?
On the surface, there really wasn’t anyway for you to have known that Apple was destined to reverse and head lower by simply looking at the volume oscillator in a vacuum.
Just as with any other indicator, you need to see both price and volume confirm the move. Once the price action began to creep back below the breakout level, that was your cue to exit the position.
If you get nothing else out of this section of the article, remember that you cannot trade breakouts with the volume oscillator blindly. You must have some predefined method for confirming the trend.
#2 – Riding the Trend
Volume in a strong uptrend or downtrend can be quite deceiving. The volume will appear to just float with little fan fair as the stock continues in the direction of the primary trend. This can prove challenging to interpret, because it’s as if the market is floating with little purpose when in actuality the lack of push from participants should trigger a reversal.
Let’s look a look at the perfect example where the volume oscillator would have kept you in a position.
volume oscillator and strong trend
First, let me say that I personally hate these types of charts, because it leads people to believe you can find these setups on a daily basis. Let me be clear, they are super rare. You are better served making consistent profits instead of looking for these 90-degree charts.
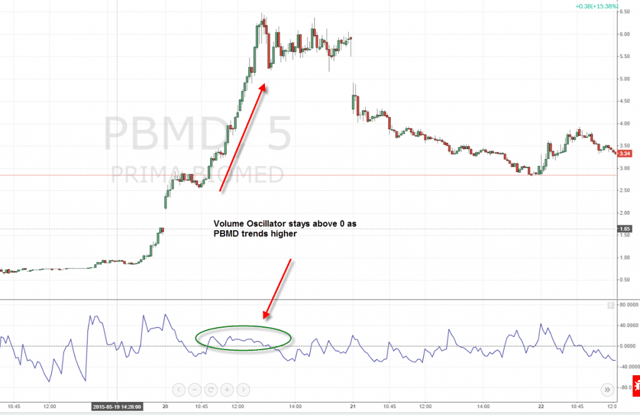
Now that I have placed the disclaimer, PBMD had a massive intraday move.
After clearing resistance at the $3 dollar level, the stock began to rally significantly all the way up to $6 dollars. Looking back at the chart, there was no reason present to sell, but let me tell you that sitting with that much of a paper profit on a day trade is one of the toughest things you can face in life.
Upon further review, you can see that the volume oscillator did a nice job of containing the trend as the oscillator never dipped below the zero line. This tells you as a trader that the short-term strength in volume was behind the move and the stock was headed to higher ground.
The likelihood of you finding a stock that hovers above its 0 line on the volume oscillator will be hard to find, but when all starts align, it’s a beautiful thing.
#3 – Volume Oscillator and Choppy Markets
You figure this one out and I will give you a gold medal. The volume oscillator in my humble opinion provides a ton of false signals when the market is trading in tight ranges. The price and volume action will look non-existent, yet the oscillator could be moving above and below the 0 line. As a trader, this would really annoy me as the appearance of underlying strength or weakness is nothing more than a false signal.
Let’s look at a few chart examples for clarity.
Volume Oscillator and Choppy Markets
Is it me or do the spikes in the oscillator make it appear as though there is more going on in this chart? The bottom-line is that we have no idea which way the stock will break and only time will tell whether the bears or bulls are correct.
What you can see using the volume indicator is that there is an increase in the volume when the stock finally broke support. Which is a perfect segue into the next section of this article.
#4 – Drawing Trendlines on the Volume Oscillator
Another method used to trade with the Volume Oscillator is to actually draw trendlines on the indicator. The goal here is to identify breakout patterns on the indicator to signal the stock price will also likely start trending. I’m not a big fan of this approach as it starts to clutter your chart and I feel like the breakout is just a coincidence as you are working with a large number of data points. At times the volume oscillator will breakout prior to the trend and other times it won’t.
It’s just the law of averages.
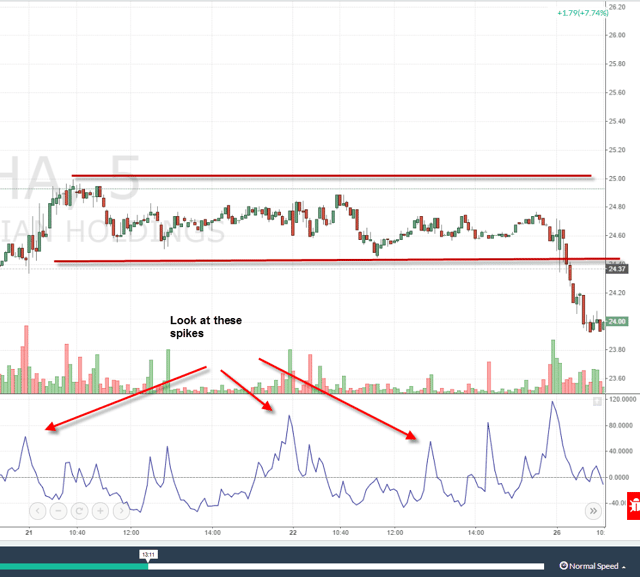
Below is an example of where the volume oscillator was able to break through a trendline, as price was also making a breakout on the chart.
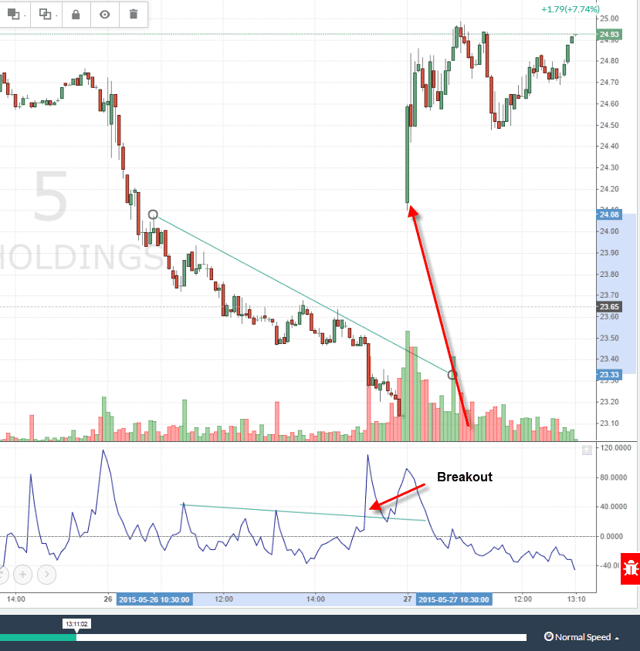
volume oscillator trendline breakout
In the above example, Hawaiian Holdings (HN) had a breakout of the volume oscillator and then a back test of the trendline prior to breaking out. I haven’t run a detailed analysis on how often this occurs, but again my gut tells me that it boils down to at some point, lines on a chart start to tell the same story. It just so happens these stories are just by chance.
Volume Oscillator versus Volume
Here is the real test. Does the volume oscillator add any additional value that isn’t already present in the volume indicator?
The reason I am asking this question is because traders as a whole need to simplify their methodology.
Trading is the same way. As you begin to hone your craft, you may find yourself in a trap where you are adding more and more indicators on the chart. Call it a security blanket, insecurity or just over thinking it, your chart can begin to fill up.
So, always challenge your desire for one more indicator.
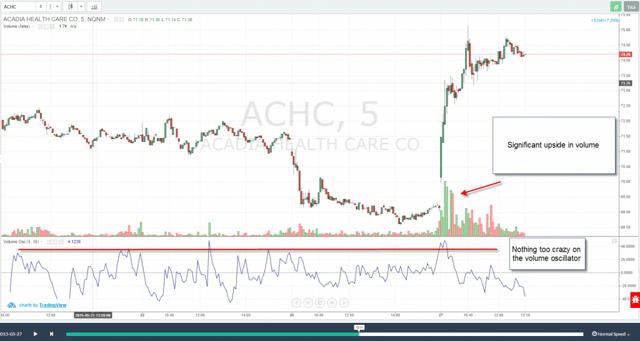
volume oscillator versus volume
In this example, we are looking at ACHC on a 5-minute timeframe. Notice how the stock shot up on high volume. After the initial breakout, ACHC consolidated for a few candles and then screamed higher again. As you can see in the volume activity, this was a huge surge as the volume was many multiples higher than the average.
Now take a look at the volume oscillator. The oscillator definitely made a strong move higher, but the oscillator failed to drastically exceed any of the recent peaks for ACHC.
Therefore, the answer to this question is because the short-term and long-term periods are 5 and 10 respectively.
If we expand the delta between the slow and fast periods, the volume spike is a bit clearer, but not by much.
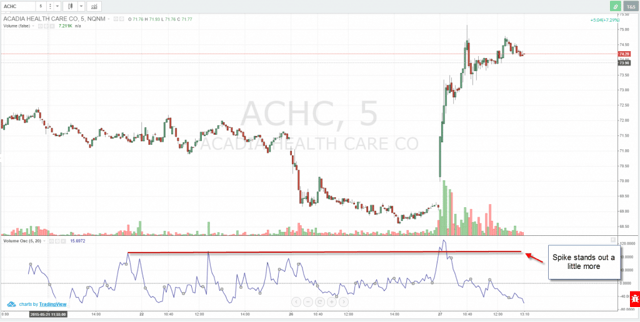
While the peaks are a bit clearer, the volume oscillator doesn’t come close to standing out as well as the volume indicator. Why do you think this is the case?
Simply put, as the slow and fast volume averages surge higher, they do so relative to each other. Therefore, you will never get the contrast you would find looking at each volume bar side-by-side.
Final Verdict
The volume oscillator like any other indicator can prove useful when combined with price action and trend lines. I do however, feel like in the long run, it’s better to have a solid understanding of the volume indicator to ensure you can see the bigger picture and not get too lost in the spikes of the volume oscillator.
If you still want more regarding the volume oscillator, please check out this informative video posted by Jeff Bierman on YouTube.
I hope you found this article helpful and if you want to test drive the volume oscillator for yourself, feel free to visit our homepage to gain a better understanding of the Tradingsim Platform.
Much Success,
Al


 Volume Indicators


