Gap trading can be one of the simplest of technical trading approaches to day trade the futures markets. Gaps are a common phenomenon in the stock markets where the pre-market and after hours markets tend to see prices gap higher or lower.
The popularity of trading gaps is seen by the fact that it is often employed by professional futures day traders and also the simple to understand rules makes it a perfect way to get started with technical analysis trading. The E-mini futures contracts being one of the most popular of the stock index futures trading contracts is known for the fact that price action respects the technical analysis. It is not uncommon to find various E-mini trading strategies and among the different approaches to trading E-mini futures contracts, trading with gaps is one of the easiest of all trading methods whether you want to trade the E-mini S&P500 or the E-mini Dow futures contracts.
The basics of trading gaps with E-mini futures is to look for price that gaps above or below from the previous day or session. This usually happens either after the markets reopen from the trading break or at the start of a new trading week or a trading day. Gaps can also occur during the pre-market trading hours and just before official trading starts as well as intraday depending on any unscheduled news or event which hasn’t yet been discounted by price.
In order to trade gaps with the E-mini futures successfully, we need to understand what are price gaps and why they are formed.
What is a gap in price?
A gap, as the name suggests is nothing but a change in open and closing price levels that can occur over two sessions. The sessions can be as small as a 1-minute chart or a daily chart. Gaps occur due to high trading volume at a particular price level which results in prices surging or jumping above or below various price levels and leaving a gap as a result.
A gap is one of the most visually distinctive patterns that can be seen on candlestick and bar charts. It depicts the discontinuity between two price bars or sessions on the chart.
Gaps can occur at the start of a trading session or when there is low liquidity in the markets. In some instances, an important news release can also result in prices gapping higher or lower but this is often found on the smaller time frame charts.
A gap, from a technical perspective and in the context of trend is defined into three types:
- Breakaway Gap: A breakaway gap is often said to occur during the start of a new trend and depends on which point in time and price the breakaway gap occurred
- Runaway Gap: A runaway gap occurs in the middle of a trend and is said to show a renewal of the previous trend. When trading gaps, a runaway gap offers the biggest success in trading with the trend that was formed previously with a breakaway gap
- Exhaustion Gap: An exhaustion gap is the final leg of the trend and occurs as the existing trend nears exhaustion. An exhaustion trend can also be defined as a breakaway gap especially if a new reverse trend starts immediately
Besides the above definition of gap, the gap itself can be classified into two major categories.
- Full Gap: A full gap is defined as a pattern where the opening price of the current bar or candlestick is greater than the previous session’s high. A full gap can be a full up gap or a full down gap.
- Partial Gap: A partial gap is defined as a pattern where the opening price of the current bar or candlestick is higher than the previous session’s close but not higher or lower than the previous session’s high or low.
The chart below shows an example of a full gap and partial gap, which is easy to identify visually.
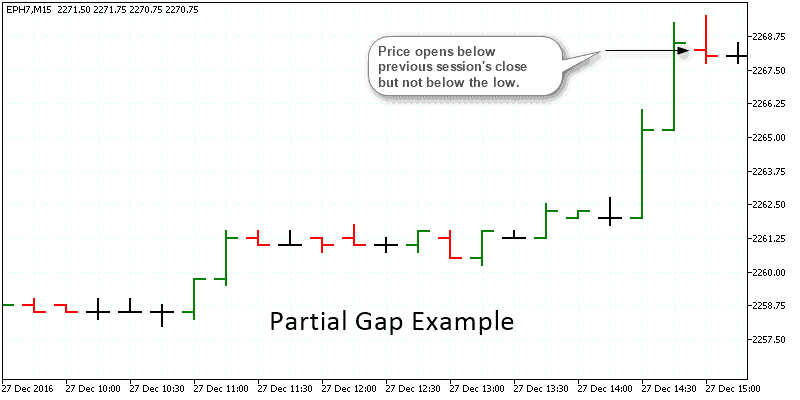
Example of partial gap
The above chart shows a partial gap where price opens below the closing price of the previous session but not above or below the previous session’s high or low.
The next chart below shows an example of a full gap. Here you can see how the opening price of the bar/session was completely above the previous price bar.
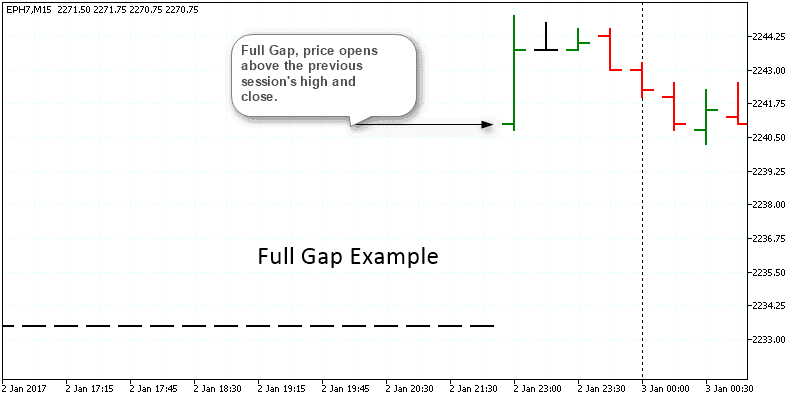
Example of full gap
When trading gaps, it is important to understand the difference between the partial and a full gap. Generally, a full gap is the stronger of the two patterns and is more reliable in trading, while a partial gap will need some extra caution and validation from other methods. Partial gaps are more common compared to full gaps.
Having the above information, let’s look into four simple gap day trading strategies with E-mini futures.
#1. The evening/morning star pattern
The evening star pattern (and its opposite, morning star pattern) is one of the easiest of gap patterns that you can trade. The occurrence of the evening star pattern is not very common but when it does occur, the pattern can be considered to be highly reliable.
An evening star pattern is made up of three price bars or candlesticks with a price gap on either ends. An evening star occurs at the top end of a trend, while its opposite, the morning star occurs and the bottom end of a trend.
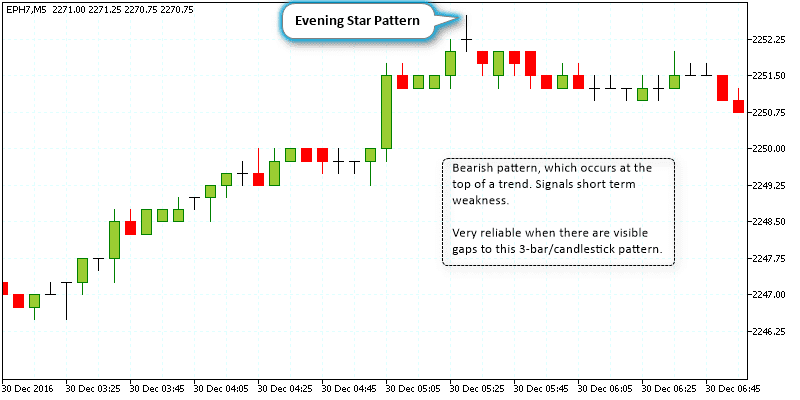
Evening star pattern on a 5-minute E-mini S&P500 chart
The above chart shows the evening star pattern that was formed after a steady rise in prices. This was a strong pattern as gaps were formed on both the left and right side of prices. An evening star pattern is bearish and can signal a reversal or a retracement to the trend. With an evening star pattern, you can reliably take short positions after the low of the evening star pattern is breached.
The next chart below shows the opposite, which is a morning star pattern. This usually forms near the bottom end of a downtrend and can signal a short term reversal in prices. Unlike the evening star pattern above, which is a near text-book set up, the morning star pattern is a rather mild version. Still, the validity of this pattern is based upon the full gap which as we know is a more reliable gap that one can trade.
Following the morning star pattern, prices eventually start to push higher. Long positions can be taken after the high is breached.
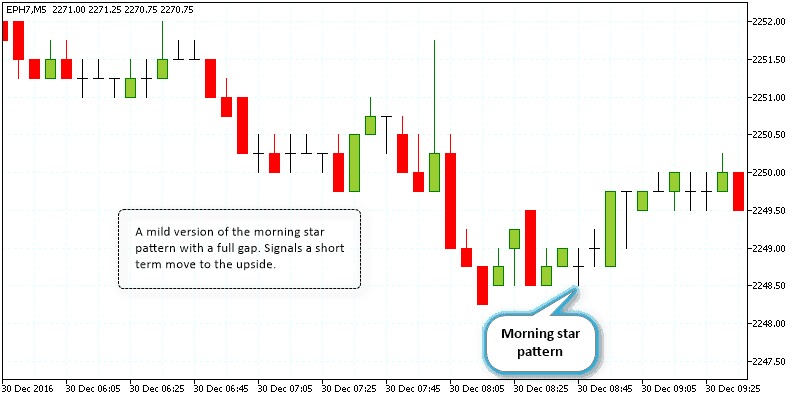
Morning star pattern with a full gap
The most important aspect of trading the morning and evening star patterns are the two gaps that are essential to validating the pattern. As illustrated above, a full gap on the pattern is a lot more stronger pattern than a partial gap.
#2. Gap as support/resistance levels
Due to the strong price action formed on account of gaps, they can be a reliable support or resistance levels. Traders can therefore look at gaps in prices (the stronger the gap, better the level) and plot the support and resistance levels accordingly and trade the bounce off such levels.
The next chart below shows two gaps that are formed. The first full gap that is formed has managed to turn to resistance level. Due to the fact that the gap was a full gap, the resistance level was more reliable. On the other hand, the small gap zone formed on the basis of a partial gap was easily broken on the second attempt to the downside.
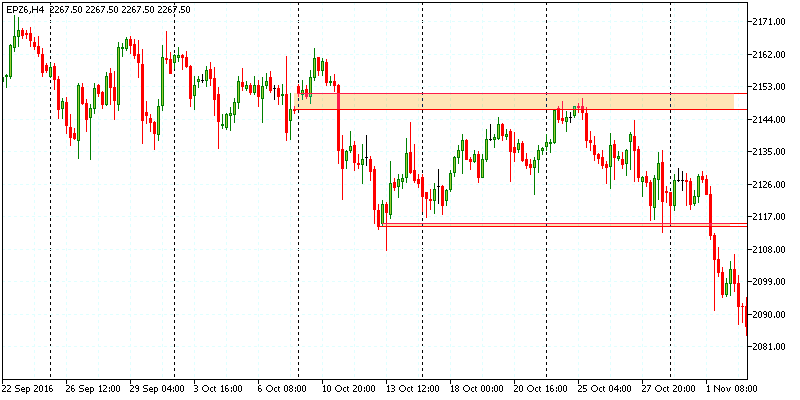
Using gap as support – resistance levels
In this approach, the purpose of using gaps is merely to identify support and resistance levels. Once the levels are plotted, day traders can then use any of their own trading methods and trade the levels. The only thing to bear in mind here is that a full gap will serve as a stronger resistance or support level than a partial gap.
Day traders should apply some objectivity to this method as analyzing too many gaps can often yield many price levels that will eventually weaken or confuse the price bias.
#3. Trading Gap pullbacks on E-mini futures
Gap pull backs are one of the common ways to trade the gaps. In this approach, the conventional method is to wait for price to gap up or down and then buy or sell on the pull back. This method works well on stocks but on the E-mini futures contracts, the pull backs can be quicker and a bit different.
A modified approach to trading the gaps is to firstly plot the gap zone that was formed. Once the levels are plotted, day traders can wait for the zone to be breached and retested with a subsequent buy or sell order initiated. The chart below shows a gap that has been plotted.
A long or a short order can be placed at the high or the low which would be validated by price bouncing off the gap zone.
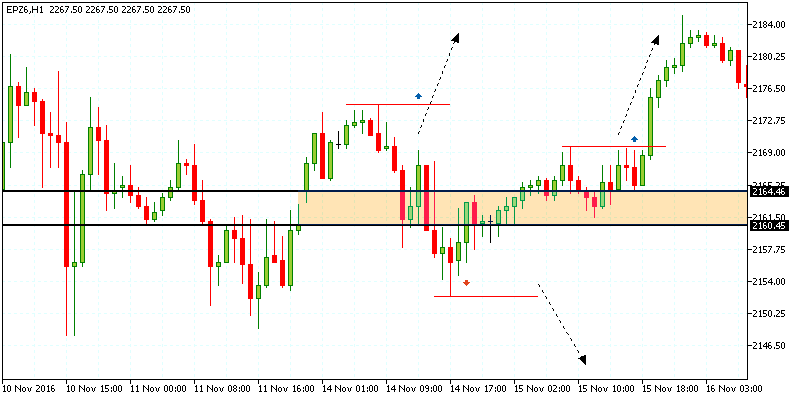
Trading pull backs to the gap zone
In the above chart we can see a first long position that can be placed on the initial high. In this set up, the long order would have been triggered if price tested the gap zone and bounced back taking out the previous high. However, this didn’t happen and price fell below the gap zone forming a low. A short position is now placed provided price bounced off the gap zone and took out the initial low, which again did not happen.
Finally, price breaks above the gap zone and forms a local high and then dips back into the gap zone. This time, price breakout above the local high, triggering the long position.
#4. Trading the opening gap
On some trading days, the E-mini contracts can open with a small gap during the start of a new trading session. This might not be visible or prominent on higher time frames, but when you look to the 1-minute chart the gaps are easy to identify. In this method, simply plot the gap zone at the open. Sticking to the 1-minute chart, go long or short on the market after a bullish or a bearish candlestick pierces and closes above or below the gap zone.
The chart below shows the price zone that was plotted after the initial gap was formed. A few minutes later we have the first sell signal of the day with a bearish candlestick piercing and closing below the gap zone. A short order is taken here and held for 1-minute and closed out.
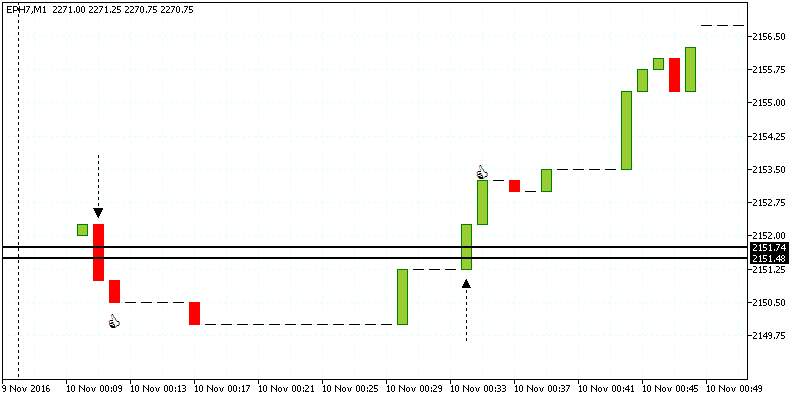
Trading the opening gap on 1-minute chart
A few sessions later, we have a bullish candlestick that pierces the gap zone. A long order is taken on the bar close and held until the next bar closes. This method is applicable for day traders and works best during the first two hours of the trading session.
The above four strategies are by no means the only way to trade gaps on the futures markets. Traders can look at developing their own gap trading strategies on the E-mini futures contracts. The key in determining the success of any gap trading strategy is the fact that the method should be tested in different market circumstances (sideways, trending markets) to fully understand the pros and cons of the gap trading strategy that you want to develop. Therefore, before putting any strategy to the test with real money, futures traders should always test the gap trading strategies on a simulated trading account in order to be fully familiar with the trading system that they will make use of.
Besides having to back test the gap trading strategy, day traders should also focus on the instrument in question. For example, gaps that are formed on E-mini stock indexes such as S&P500 or the Dow can be different to the gaps that are formed on wheat futures for example. Therefore, day traders should not make the mistake of treating all the gaps equally regardless of the instrument that they are trading. As mentioned, the best way to put a strategy to test is to back test on a simulated trading account. Remember that a gap trading strategy that is used in one market will not guarantee same results when used in a different market, which is one of the reasons why that any trading strategy that you come across or design on your own, needs to be thoroughly tested across different market conditions and instruments before using it on your real trading account.


 Awesome Day Trading Strategies
