The 3rd wave extension is drawn upon the Elliott wave theory. The Elliott Wave theory is a rather simple and a straight forward theory that was created by Ralph Nelson Elliott. The Elliott Wave theory was first published in 1938 in the book, “The Wave principle.”
Early on, the Elliott wave theory came under numerous misinterpretations, and it is to this day. The misinterpretation led to the next book being published by Ralph Nelson Elliott called “Nature’s Laws: The secret of the universe.”
Because the Elliott wave theory is open to interpretation, it often leads to the outcome that wave counts tend to differ.
What makes Elliott wave theory so confusing with chart technicians is the wave count. There is no doubt that there are clear rules when it comes to measuring or counting the Elliott waves.
However, in real life trading, there are many instances when the markets don’t quite tend to follow the rules to the dot. This is where subjectivity steps in and makes Elliott waves open to interpretation.
Furthermore, the fact that the Elliott wave indicator tends to occur across different time frames makes it more complex.
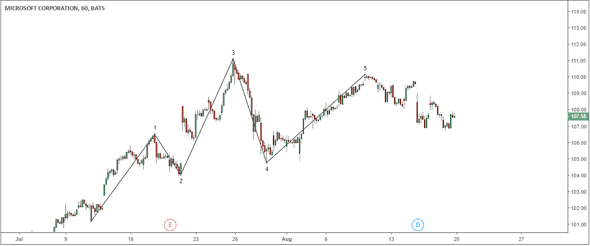
The first chart below shows the five waves in the Elliot wave theory.
Elliott Wave Count and the 3rd Wave Extension
The Elliott Wave theory
In simple terms, Elliott wave theory draws upon the familiarity of the Dow Theory of trends. Ralph Nelson Elliott found that in any trend, price tends to move in a five-wave pattern.
From the five waves, three waves were in the direction of the trend. These waves were termed impulse waves. Within the trend, the remaining two waves were termed the motive waves.
The Elliott wave patterns can be found across different trends and the waves form different degrees.
After the formation of the five-wave pattern, there are also three corrective waves. Ralph Elliott called these the corrective waves.
The Elliott waves adhere to some strict rules of retracement. Thus, it is safe to say that Elliott waves also depend on the Fibonacci retracement levels as well.
From a trading perspective, Elliott waves help chart technicians to pick turning points in a trend. We already know that within the five-wave pattern, the impulsive waves move in the direction of the trend.
Among the three impulse waves, the third wave is potentially the strongest of the three. The third wave doesn't just stand out visibly but it is also the longest of the three.
Most of the trading activity is seen to occur during the third wave. The third wave is when there is a lot of market euphoria. In most cases, traders tend to identify the third wave when it has already been established.
The third wave is also often the most sought-after impulse wave. This is because of the underlying market psychology behind it.
In the research publication “The Elliott’s Wave Theory: Is It True During the Financial Crisis?” a closer analysis is done on the third wave. The research aims to identify the market psychology behind the third wave pattern.
The third wave
The third impulse wave of the Elliott wave theory is the most visually standing out impulse wave. Following the consolidation of the second wave, the third wave breaks out. The third wave extends wave one by 161.8% Fibonacci level.
In other words, the third wave is a 161.8% Fibonacci extension of the first wave. Because the third wave is also the impulse wave, this is always in the direction of the underlying trend.
In most cases, however, the third wave can extend wave one by 261.8% or in some cases 461.8% as well.
While the third wave is easily identified (in hindsight), trading the third wave as it evolves can be somewhat difficult.
The third wave forms right wave 2. It can somewhat easy to wait for the start of the third wave. However, a wrong move by price action could quickly invalidate the whole wave count.
This would mean that the trader will have to start from the beginning and count waves to adjust to the evolving price action.
This is one of the reasons why, despite the third wave being the strongest and visually standing out, it can be daunting.
The third wave (and the entire Elliott wave itself) can form across multiple time frames. Ralph Elliott called these the degrees of waves. The degrees of waves are nothing but a pattern.
Elliott wave theory also draws heavily on the concept of fractals. The degree of waves is simply recurring patterns. Each wave in the Elliott wave can be broken down into smaller degrees or patterns of waves.
The fractal nature of the Elliott wave is somewhat unique.
What is a fractal?
A fractal is simply a never-ending pattern. They are said to be infinitely complex patterns occurring in different scales. The fractal pattern in itself is very simple and undergoes an infinite feedback loop.
Fractals are not just applicable to the financial markets but follow a whole science. The research paper, “Negative Based Number systems” gives a very mathematical and complex view of fractals.
This is also seen from the research into Elliott wave theory. For example, if you take the third wave, you will find that the third wave can be further broken down into one smaller degree. This smaller degree comprises the typical five-wave pattern. Likewise, if you zoom out, you will find that the wave you look at is actually part of a larger degree.
Ralph Elliott understood the fractal nature of the Elliott wave and thus came up with different naming conventions. Avid Elliott wave traders will be easily able to recognize the waves based on the convention.
Examples of this include the Grand Cycle, the Grand Super Cycle, Minutte, Sub-minutte, etc.
How trade the third wave
So far, we know that the third wave is the strongest impulsive wave. It is an extension of 161.8% of the first wave in the Elliott wave count. This means that the third wave forms right after the completion of the second wave.
To identify the 3rd wave, the second wave has to be complete and fall within the general rules of Elliott waves.
While there are many explanations on the nature of the second wave, the one hard and fast rule is that the second wave should never overlap the first wave.
Depending on the nature of the correction, the second wave can retrace to as much as 61.8% of wave one, if not deeper. But the second wave should never retrace more than wave one.
Therefore, in order to successfully trade the third wave of the Elliott wave, traders need to keep a close watch on the second wave.
After you identify a turning point, wave three begins. The next step is wait for the 3rd wave to break the previous high or low of wave two.
After you validate the second step, using the Fibonacci extension tool, you can project the 161.8% Fibonacci level.
Trading the third wave can be even more successful when analyzing the candlestick patterns as well.
In the following section, we illustrate how you can trade the third wave based on the above simple rules.
Example of trading the third wave
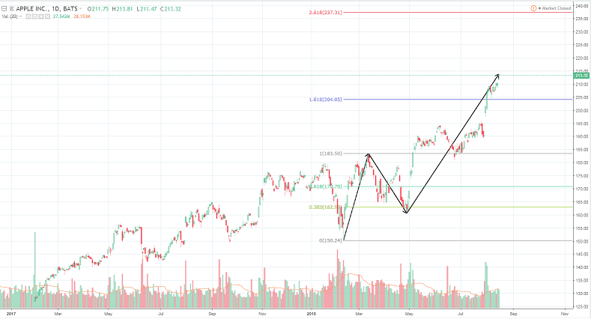
In the below example, we look at the daily chart for Apple Inc. stocks. Here, the third wave is still evolving. Notice that after the wave two formations, we use the Fibonacci tool. The retracement tool shows a decline to 0.382%. This is a normal correction to wave one.
After the decline, the second wave turns and starts to resume the direction of the main trend. After breaking the high of wave one, we can see that the third wave continues higher.
The 3rd Wave Extension – Elliott Wave in a bull trend
Using the Fibonacci extension tool, we can see that price action rallies to 1.618% of wave one. What you can observe from the chart example is that after price breaks wave one high, there is a brief retest of this high.
Taking a long position at this level would have resulted in riding the third wave early.
While there are cases when the third wave can extend to 1.618% of wave one, it is impossible to know beforehand. Therefore, traders can always book profits at 1.618% extension while leaving some positions at risk-free to target the 2.618% and further levels.
In the next example below from the GE chart, we can see that the same logic applies in an Elliott Wave downtrend.
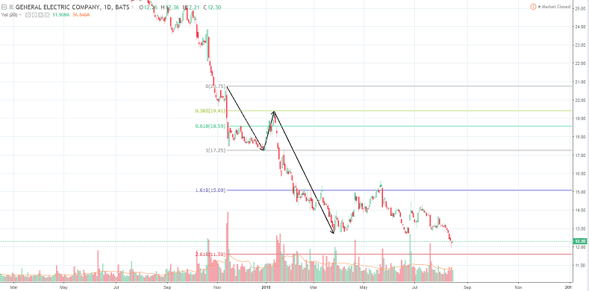
The 3rd Wave extension – Elliott Wave in a downtrend
Following the retracement of wave two, the break of the low of wave one triggers the start of the third wave. Following a brief retest of the low of wave one, a quick retest of this level triggers short position.
Traders can book the first profit at the 161.8% Fibonacci extension level of the first wave. The remainder of the position is left open with no risk and an aim to capture more profits. This will enable the trader to capture more profits as the trend momentum increases.
Using the wave degrees to identify the third wave
Another method to trade the third wave is to first identify the third wave of a higher degree. Think of this as counting the waves on the daily or weekly time frame. When you identify the third wave, you can then look to the smaller time frames
It is due to the fractal nature of Elliott waves that allows traders to look for the third wave of a lesser degree to form. In other words, you would look for the formation of this third wave on a smaller time frame.
One of the major drawbacks of using this method is that it requires the trader to look at multiple time frames. The multiple time frame approach is not suitable for most traders. However, for day traders this could be a great way to trade with an increased probability of success.
Another drawback is the fact that if price action invalidates the retracement levels you would need to restart counting the waves again. The next chart below illustrates this method.
The thicker line depicts the Elliott wave of the higher degree. After the main Elliot waves 3rd wave extension forms, you can look at various turning points based on the Elliott waves of a lesser degree. The same approach will enable traders to pick good turning points within the wave count.
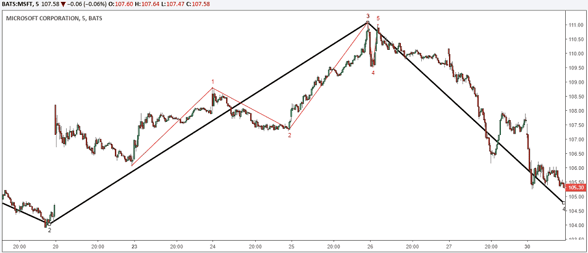
Elliott Wave – Degree of waves
Why trade the third wave in Elliott waves?
It is a known fact that Elliott wave theory can get a bit overwhelming. The counting of the trades can be quite a task. In most cases, a wrong count of the trade can leave the analysis invalid.
Furthermore, there is the fact that Elliott waves can become subjective in some cases. This could lead to incorrect analysis which can result in potentially devastating trade entries.
To avoid all of this, traders can simply focus on the third wave of the Elliott wave theory. By starting with identifying the trend and trading the third wave, traders can enter this potentially powerful wave with ease.
The fact that this method allows for an early entry into the trade can give you the added advantage of booking more profits. The third wave of the Elliott wave method is compatible with other technical indicators.
This can lead to further validation of the price action and can result in higher probability trades. However, traders need to apply caution as using too many indicators alongside an existing method can lead to analysis paralysis.
Pure price action enthusiasts can also utilize this approach to develop a robust trading strategy that draws up trading psychology and tried and tested concepts.


 Awesome Day Trading Strategies


