DAX futures are the derivatives market tracking the main German stock index, DAX (Deutscher Aktien Index). It is the main blue-chip stock index which tracks the performance of 30 companies listed on the Frankfurt stock exchange and is called as the DAX30. The DAX futures are offered by the Eurex exchange, a futures exchange specializing in offering European futures.
The DAX index is a capitalization-weighted index and tracks the performance of the largest and most actively traded stocks on the exchange. The DAX carries similar weight such as the Dow Jones in the U.S. The 30 companies listed on the DAX exchange are as follows:
| Adidas AG |
Commerzbank |
Deutsche Telekom |
Infineon AG |
RWE AG |
| Allianz SE |
Continental AG |
E.ON |
Linde AG |
SAP |
| BASF SE |
Daimler AG |
Fresenius SE |
Lufthansa |
Thyssenkrupp |
| Bayer AG |
Deutsche Bank AG |
Fresenius ST |
Merck |
Volkswagen AG |
| Beiersdorf AG |
Deutsche Boerse |
Heidelbergcement AG |
Muench. Rueckvers |
Vonovia |
| BMW |
Deutsche Post |
Henkel |
Prosiebensat 1 AG |
|
One of the unique features in the DAX index being that the maximum weight a listed company can be assigned is 10%. The DAX was formed with a base bade of December 30, 1987, and started with a base value of 1000. Between the periods of 2003 – 2007, the German DAX was in one of the strong bullish rallies ever, rising to the highs over 8,100 during the period.
DAX Futures Chart
Among the many regional stock indexes of Europe, the German stock exchange is one of the most actively traded exchanges in the region. The DAX futures come in various forms from the standard futures contract to the mini-sized DAX futures with a multiplier of 5 EUR. The DAX futures are priced in euro which is then converted to U.S. dollar.
Below are the two main DAX futures contract types available for trading.
| |
DAX Futures |
Mini-DAX Futures |
| Underlying |
DAX30 |
| Index Type |
Total return in EUR |
| Eurex Product |
FDAX |
FDXM |
| Contract Value |
EUR 25 |
EUR 5 |
| Minimum Tick |
0.5 index points |
1 index point |
| Settlement |
Cash |
| Final Settlement |
Third Friday of the contract month |
| Trading hours |
08:00 – 20:00 CET |
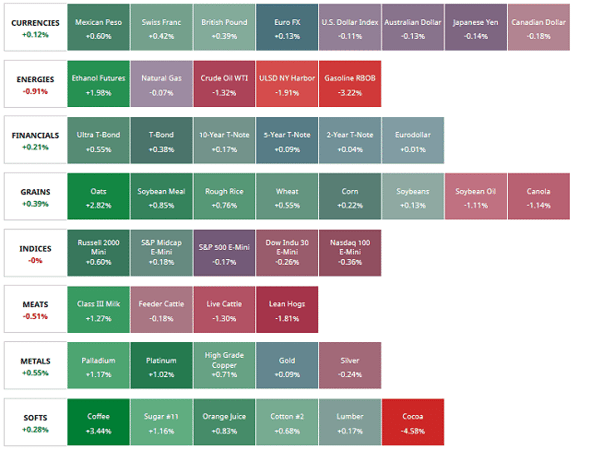
Day trading the DAX futures can be a profitable venture, similar to trading the E-mini S&P500 futures. Before we look at the three of the simplest trading strategies, it is best to explore the correlations between the DAX and a few other instruments to get a broad idea of how the DAX behaves.
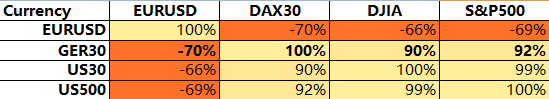
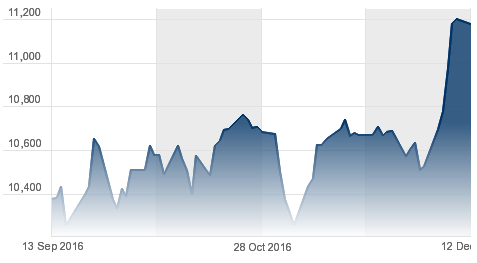
DAX Correlation Chart (30 day correlation)
The above chart shows the correlation between the DAX 30 Index and the Dow Jones Industrial Average and the S&P500 including the EURUSD (because DAX is priced in Euro).
The above chart shows that the DAX index has over 90% correlation with the leading U.S. stock indexes and has a 70% inverse correlation to the euro. This means that when EURUSD moves higher (the euro rises), the DAX index tends to be weaker and when the EURUSD moves lower (the euro falls against the U.S dollar), the DAX index tends to be stronger.
The above correlation data shows how traders can use the information from other markets in order to gain a broad idea on how the DAX30 will perform.
With the above forming the basis, below are three ways you can day trade the DAX futures.
#1. DAX futures day trading with RSI
In this rather simple approach, we only make use of the Relative Strength Index (RSI) indicator on a 15-minute DAX futures chart. The RSI setting used is 14 periods, applied to closing price. The RSI also uses custom levels of 75 and 25. Long positions are taken after the RSI(14) closes above 75.00 and short positions are taken after the RSI(14) closes below 25.00.
The first chart below shows a typical long position.
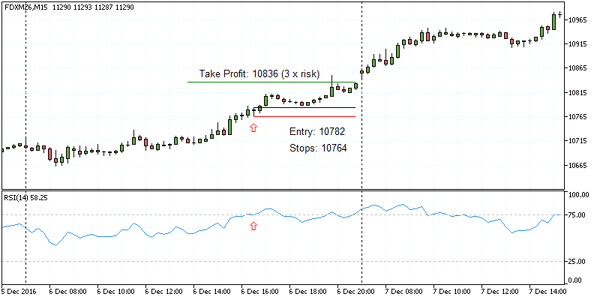
DAX Futures Day Trading – RSI Long set up
In the above chart, the RSI 14 closes above 75.00. A long position is taken as a pending buy order at the high of the candle, which is 10782. Stops are placed at the low of the candle at 10764. To determine the take profit level, set the limit order to three times the risk, which is 10782 – 10764 = 18 x 3 + 10782 = 10836.
Similarly, short positions can be taken when the RSI(14) closes below 25.00 level.
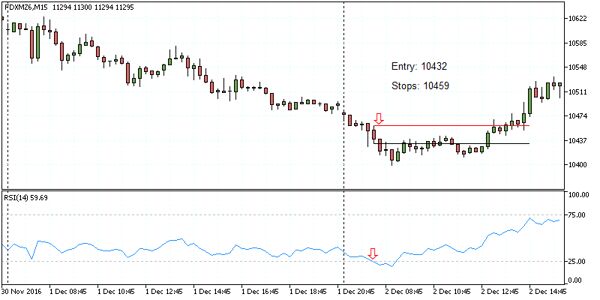
DAX Futures Day Trading – RSI Short Set up
In the above chart, you can see a losing trade in the short set up. Price initially triggers the entry but reverses back to hit the stop loss.
While losses are a part of this strategy, the 1:3 risk/reward set up allows a few good winning traders to quickly put you back into profits and make up for the losses.
An important factor to bear in mind with the DAX futures RSI trading strategy is to take only one trade per day and traders should discipline themselves to stop trading for the day after the first trade is closed out.
#2. Trading the 2-hour range breakout
Most day traders tend to focus on the first hour of trading, which may or may not be that profitable. When combining the first two hours of trading the statistics can greatly change and also gives you a better grip on the markets.
The DAX futures open at 0900 hours Central European Time or 0700 GMT. It is around this time that there are usually a lot of economic releases. Some are important, but for most of the days, the data released during these periods are usually second-tier data. This means that there is a lot of noise in the trading. By waiting for the first two hours, DAX futures day traders will be able to step aside from the noise and look for better opportunities once the trend or the range is set.
With the 2-hour range breakout, the only indicator being used is the volume data. To trade this setup, draw horizontal lines on the high and the low of the first 2-hour trading sessions. Then, observe the volume as long as price continues to range within these levels. Buy or sell on a breakout of this range, validated by higher volume on the breakout candle.
Stops are set to the high or the low of the breakout candle while profits can be booked for 10 – 15 points. In some cases, traders can be held open to the last hour of trading.
The chart below shows a long trade as well as some invalidated traders.
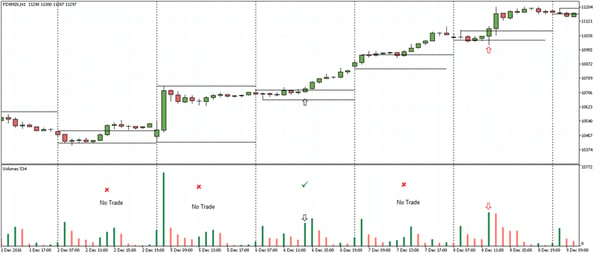
DAX Futures 2-hour range breakout – Long set up
There were only two valid trades out of four. The reason here is because starting from the left, the first trade is invalid because of the volume in the second hour as much higher than the volume on the breakout candle. You can see how price stayed flat, moving only a few points. The second invalid trade is marked by strong price movement in the second hour. Furthermore, there was no breakout from this range thereafter. The third trade set up is a near perfect set up. The initial range is set from the high and low from the first two hours. Then, price breaks to the upside on higher volume on the day and eventually closes the day higher.
The fourth trade set up shows the range being established but the breakout volume is lower compared to the initial two-hour trading volume.
Finally, the fifth trade has a similar set up to the third set up. The breakout from the 2-hour range is validated by higher volume, and price eventually closes out higher on the day.
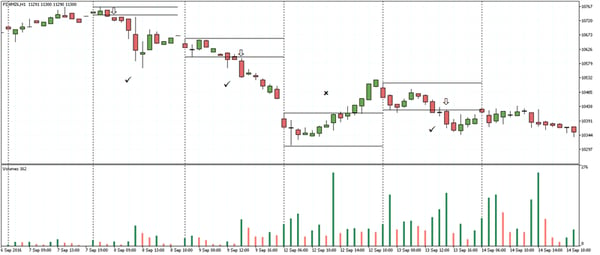
DAX Futures 2-hour range breakout – Short set up
The next chart above shows a few examples of short positions based on the range and volume breakout. Here you can see three textbook short positions as the breakout candle is validated by higher volume compared to the volume from the first two sessions. Price often tends to close lower on the day when this set up appears.
The 2-hour range and volume breakout can be very useful to capture short-term trends when they are validated by volume. However, traders should note that the setups are not very frequent and therefore there will be a few trading days with no trades to take.
#3. High/Low – Buy/Sell Trend following strategy
The DAX futures tend to follow strong trends. With the exception of the consolidation periods where price action can turn flat and whipsaw a trader’s positions, the price action is a lot more certain once a trend is established. On this basis, traders can also look at a 30-minute DAX futures trading strategy. In this method, you buy if price closes above the previous day’s high or sell if price closes below the previous day’s low.
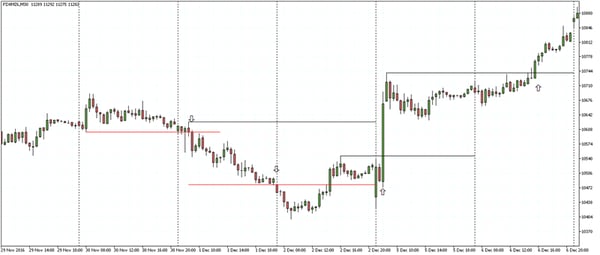
DAX Futures – 30minute chart High – Low Breakout
The above chart shows a few long and short signals. The red lines represent the previous day’s low while the black lines represent the previous day’s highs. In this method, once the 30-minute session closes below or above the previous day’s low or high, a position is entered with stops placed at the high or the low of the 30-minute breakout candle.
This is a fairly open system where traders can look at specifying a fixed take profit level or look to entering the trends on the short-term basis. In the second approach, traders should be aware of the risks of stronger pullbacks which could quickly put to risk any open winning positions.
The system can also be further modified by looking at volume validation on the breakout of the previous day’s high or low or even add moving averages to trade with the trend. The main disadvantage of this method is that day traders will need to closely monitor the 30-minute charts. There is no specific time when the breakout can occur meaning that there will be days when a day trader will have to wait for the breakout which can come only towards the end of the day.
Why trade DAX futures?
The DAX futures offer day traders a way to gain exposure on the German markets. As a leading economy in the Eurozone, the DAX30 is one of the widely watched stock index in the region. This also means that the futures markets are quite liquid when compared to other regional indexes. Although the DAX futures behaves similar to the U.S. Dow Jones industrial average, the DAX30 is often more volatile to the European Central Bank’s policies. The index can exhibit strong volatility as it is impacted by events from any of the peripheral countries in the Eurozone.


 Day Trading Basics


