There are a number of moving averages talked about across the web, so it’s pretty clear that moving averages are an important part of technical analysis. One of the most popular averages is the 2o-period.
But when should we use the 20-period moving average? Is it possible to use a 20-period moving average when active trading stocks?
In this post, I am going to detail how I use the 20-period moving average when trading and how the average can help keep you on the right side of the trade.
Why the 20-Period Moving Average?
The 20-period moving average is in the sweet spot of not too short and not too long of a look back period. The 20 is also a clean multiple of the 5 and the 10, which also produces a nice confluence on the chart.
Lastly, it’s just popular. For those of you that read the Tradingsim blog, you are well aware of the fact I do not advocate using some random moving average in order to develop an edge.
Can You Use the 20 Period Average when Day Trading?
The simple answer is yes! Many traders focus on the 5 and the 10-period MA, but the 2o brings a unique element to analyzing the market. The 20-period moving average allows you to stay pinpoint the primary trend. It is honestly one of the indicators I look to for when I need to determine if I’m just flat out wrong or a trade has gone against me.
How Did I Discover the 20-Period Moving Average was Important?
I discovered the value of the 20-period moving average simply by putting on crappy trades.
Getting Crushed Going Against the 20-Period Moving Average
For example, I would go long a day trade when the stock was well below the 20-period moving average. What do you think happened as a result of this poor decision? You guessed it right, the stock would likely roll over after a minor bounce and make fresh lows.
Let’s make this real by scanning through some real trade examples.
Going Against the 20 Period Moving Average
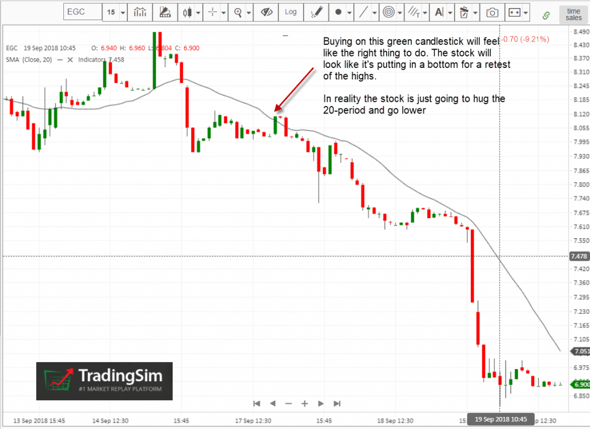
Without having the moving average on the chart, the stock will give the impression that a bottom is being put in place and a test of the highs is on the horizon.
Wrong!
I cannot tell you how many times I have found myself on this side of the trade. The large candle coming off the bottom would always suck me in like a moth to a flame. If you are going to play this kind of setup, the key is to place your stop below the large candle. There is literally no reason the stock should ever get below that price if the setup is real.
Going Against the Trend
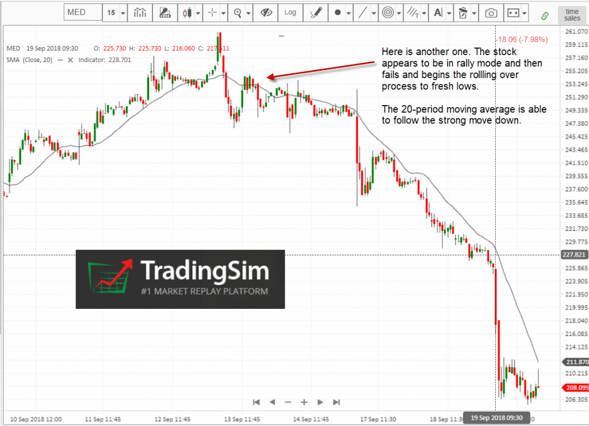
In this example, the first real breach of the 20 moving average wasn’t too violent. The stock had a few candles go below the average and a weak rally attempt was made at the highs.
After this weak attempt, the stock began to trade sideways. This is a key point to call out in that stocks will not always roll over and spike down. At times patience is required before the short trade sets up.
At any rate, going against the 20 moving average was the wrong move. The stock eventually rolled and once the low of the first breakdown was breached, things really got going.
I know what you are thinking, the 20 is a great buying opportunity.
I agree with you 100%, but notice how in these examples the stocks had candles close completely below the 20 moving average for a number of periods. This means there is real weakness and where there is fire, there is smoke.
Exiting Too Soon
Next, I would exit positions well before the stock gave any indication that it was breaking down. I would be obsessing the 5-period of 10-period moving average and the test of these averages would send me into panic mode. I couldn’t click my mouse quickly enough to exit the position.
Of course, this knee-jerk reaction would result in seller's remorse as I look back only to see the stock find support and rally higher.
Take a look at this chart for a working example.
Exiting Too Soon
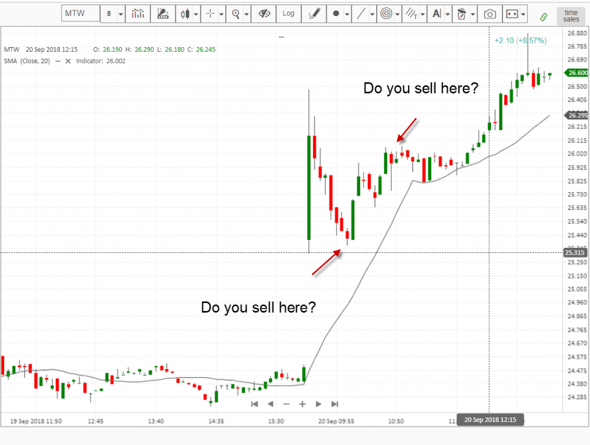
You may have encountered this sort of chart. You have a big green candle that gives it up. The stock then pulls back and you have no idea if it’s going to roll over or make new highs.
If you buy right on the open and you end up nicely on the first bar, only to have the stock pullback, you are likely looking for a point to exit the trade.
This is the pain and the curse of the market – knowing when to call it quits and book profits.
This constant battle within yourself of when to pull out will never leave you. It’s something that to this very day is hard for me to process and I have to handle the emotions of fear of losing out on every trade.
The key point in how the 20-period can help you manage the trade is by the sheer fact the stock is strong enough to stay above the average. So, if you feel the need to sell, take a deep breath and remember the trend is still your friend.
All Day Holds
Full disclosure, I am still unable to hold on to stocks for the entire day. It’s a combination of my inability to pick the winners the later and later it gets in the day and also the fact all day trading is tiring. There is a lot of effort put into staring at the screen all day, but there isn’t always a ton of profit for your efforts.
This is where the 20-period moving average comes into play by helping provide a line if the sand where a strong trend should not breach if it’s real. This way you can sit back, relax and not overreact to every gyration in the market.
All Day Hold
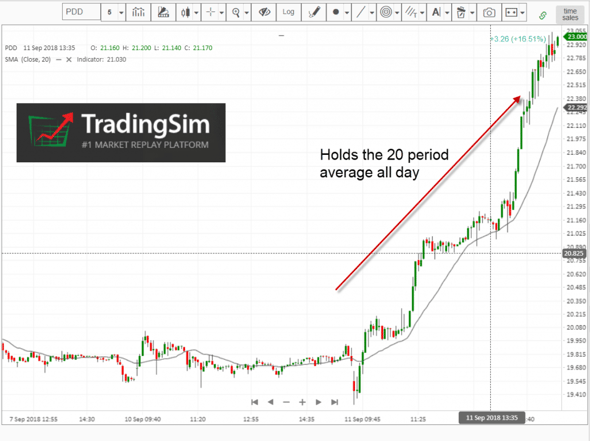
These trades will only set up about 20% of the time, so don’t go killing yourself trying to find them every day. The point here is that if a stock is trending strongly, the 20 period has the ability to follow the trend all day long.
One additional point is that you are going to need the market trending strongly to increase the likelihood of the trend going all day.
For me, I do not chase the all-day holds. Again, I do not like sitting at the screen all day or leaving some alert on in the background that will give me a serious case of shock when the bells start sounding.
I also start to see all-day trades when there are none in the market. It’s like my brain begins to manifest this unlimited sea of wealth.
Not trying to sway you either way, because I know there are some traders that make money this way on a daily basis.
Late Day Breakouts
Late day for me is really anything after 10:30 in the morning. My trade history has shown me over the years that it’s best for me to enter positions no later than 10:10 with an expectation to be out of my positions during the 11 o’clock hour at the latest.
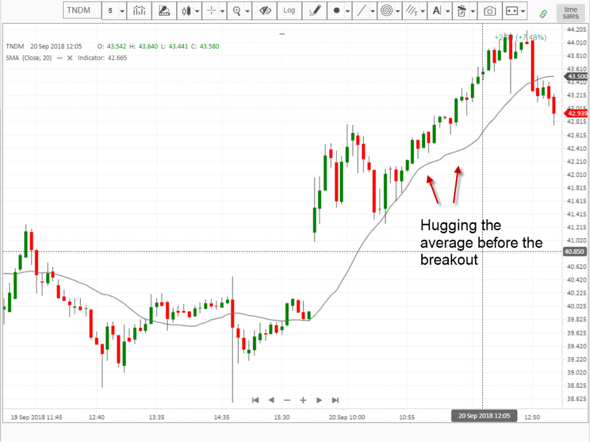
Well, one thing I have noticed is that if a stock is hugging its 20-period moving average prior to breaking out you have a great setup to trade.
For starters, if the stock fails and closes beneath the average, you are taking on minimal risk because the price is hugging the average so closely.
If however, the stock breaks out, you can use the 2o-period as mentioned earlier in the form of an all-day hold.
Let’s take it to the chart for an illustration.
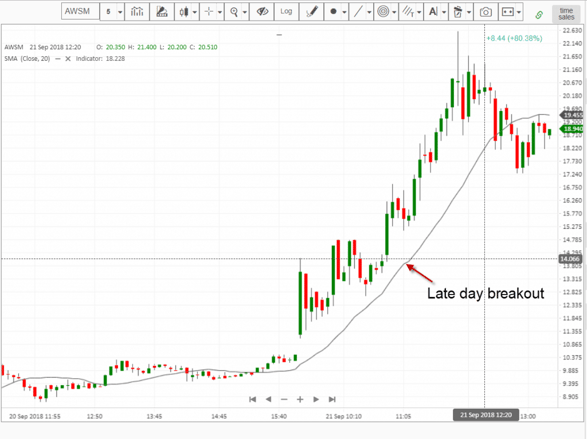
late day breakout
Notice how the stock is trending higher and the moving average is also curling up and to the right. This pattern of the price and the averages is something you will need to train your eyes to spot in the market.
The closer the stock is to the average the better. Since you are doing a late morning trade, you want the price to hover close to the average. The reason is, you could end up holding the stock for hours waiting to see if the stock is able to hold the average.
Late Morning Breakout
Here is another great setup of a late morning continuation pattern. Notice how the price stays above the average and is able to eclipse the day's high and push to new heights.
Where the 20 Moving Average Can Fail You
It’s important that you understand potential blindspots when trading the 20-period moving average and where the indicator can fail you. [1]
Early Morning Trading
You should be aware of where the 20-period average is in the early morning, say within the first 30 minutes or so. However, you should not use the 20-period average as your primary exit strategy. This is especially true when trading volatile stocks because the price is too far from the average.
I like to use the 1-minute chart when trading volatile stocks and I still do not like to see price break through the 20.
Ignoring Sell Signals
Every time I get cute and hold onto a play after the 20 is breached, even if it works out, I end up losing in the end. The reason is that it breeds bad habits and starts the process of letting hope creep into your trading. Remember, you should execute trades like a robot with little to no emotion.
Summary
The 20 period moving average is critical as a guidepost for the primary trend and also for managing trades you have entered in the early morning.
But like anything else when it comes to trading, you need to practice using the average to determine how best to fit it within your trading system.
The key point to take away from this article is the 20-period matters. Not because it’s any better than any other average, it’s just that enough traders watch it on a daily basis.
To learn more about how you can practice trading with the 20-period moving average to help your trading, please visit https://www.tradingsim.com to see how we can help.
External References
- Moving Average Study. thepatternsite.com


 Awesome Day Trading Strategies


