5 Steps for How to Successfully Counter Trend Trade
Jul 20, 2016
Written by: Al Hill
We have discussed many trend trading strategies on the TradingSim blog. In this article, we will examine the 5 steps to counter trend trade, which consists of impulsive and corrective price moves.
A counter trend move is a price correction opposite to the primary trend. This move is generally smaller in nature but may take more time to complete this consolidation pattern.
Below is the image of a counter trend price move:
Counter Trend Moves
Above you see the 2-minute chart of Twitter from July 11, 2016. The blue line indicates the support line of the uptrend. Also illustrated are the three counter trend price moves, which are marked with the black arrows on the chart.
If you are able to identify this price action, you will be able to locate counter trend moves on any price chart.
5 Steps for Trading Counter Trend Moves
So, is it possible to trade counter trend moves successfully? Totally!
However, there are a set of rules you need to follow in order to achieve this goal.
Step 1 – The Opposite Candle Rule to Identify the Start of the Counter Trend Move
When a stock begins an impulse move, you first want to draw a trend line. This support or resistance line will allow you to distinguish between impulses and counter trend moves.
While a stock is trending, you should constantly watch for opposite candles in order to identify when an impulse move is likely coming to an end.
In order to proceed to Step 2, you would first need to identify a candle that is opposite in nature to the primary trend.
This is the hardest step of the 5 step approach for trading counter trend moves. You have to somehow know that the primary trend is ready to take a breather.
In all my years of trading, one thing is constant, any surprises in price action are generally in the direction of the primary trend.
Step 2 – The Confirmation
The confirmation of the pattern can occur in two ways. The first one is to get another opposite candle on the chart. The second method is the confirmation candle is part of a reversal pattern.
Another Candle Opposite to the Primary Trend
Notice that this rule will fail at times since two opposite candles are not a strong confirmation signal. Yet, the success rate of this approach will be more than 50%, which is enough to implement a profitable counter trend strategy.
Reversal Candle Pattern
Other confirmation of the counter trend trade could be a candle, which completes a reversal candle pattern. This could be a single hanging man, or a shooting star on the chart. However, the candle could also be the second candle of a double or triple bottom candle pattern.
Example 1: Let’s say you get an opposite candle and you complete Step 1. Then you get another candle, which engulfs the opposite candle from Step 1. If this happens, you will have an engulfing reversal pattern on the chart.
Example 2: After the opposite candle on the chart, you get a candle, which is fully engulfed by the previous candle. In this case you will have a harami reversal pattern.
In both cases, you will have a confirmation of the impulse reversal and hence confirmation that a counter trend move is beginning.
Counter Trend – Reversal Candlestick
Above you see an impulse move, followed by a counter trend. At the end of the impulse, the price action creates an opposite candle.
Also, this candle engulfs the previous candle, which creates an engulfing reversal pattern. This gives us a bearish signal on the chart, which alerts us that a counter trend might emerge. As you see, the price decreases to the bullish support line.
Step 3 – Trade the Contrary Trend
After you confirm an emerging counter trend price move, you should look to open a position.
If the general trend is bullish, then the expected counter trend move will be bearish. In this manner, you should open a short position.
If the general trend is bearish, then the expected counter trend price move is bullish. This means that you should open a long position.
Step 4 – Counter Trend Stop Loss
I recommend you always set a stop loss when you trade a counter trend price move. The proper location of your stop order is as follows:
Bullish Trend – Above the top between the trend impulse and the expected counter trend move
Bearish Trend – Below the bottom between the trend impulse and the expected counter trend move
Step 5 – How to Book Profits Trading the Counter Trend
Now that we discussed how to confirm potential counter trend moves, when to enter the market and where to place the stop, we need to talk about how long you should hold your trade.
The rule here is simple. You should hold your trade until the price action during the correction touches the general trend line. You should close your trade once this occurs.
Counter Trend Trading Strategy
Now that we have covered all five steps for trading counter trend price moves, let’s now go through a real-life trading example.
Counter Trend Trading Example
Above is the 3-minute chart of Visa from July 6, 2016. The image illustrates a bullish trend and two counter trend trades.
The price action begins with a bullish impulsive move.
On the way up, the price action suddenly creates a bearish candle, which confirms the first step of our trading strategy.
This one candle is part of a dark cloud cover, which is a reversal candle pattern.
Thus, we also confirm the second step of our strategy and the potential beginning of a counter trend move, therefore we open a short position in Visa.
We place a stop loss right above the top created by the bearish candle. This is shown with the red horizontal lines on the image.
The price then begins decreasing. Fifteen minutes after we short Visa, the price drops to its bullish trend line and we close the position.
The price then bounces upwards and starts a new impulsive move higher; however, ten periods later the price action closes a bearish candle, fulfilling the requirements of step 1.
The bearish candle on the chart engulfs its predecessor, which means that we have a bearish engulfing pattern. Therefore, we receive confirmation for the emergence of a counter trend price move. This is another sell signal on the chart and we short Visa.
The stop-loss order should be placed above the top of the engulfing pattern.
Visa begins to decrease again after the beginning of the counter trend move. Eight periods later, the price action touches the bullish trend line on the chart, creating an exit signal. We should use this indication to close our trade and to collect the paper profit on the trade.
Counter trend Trading with Fibonacci Retracements
Another method for trading counter trends is to enlist the help of Fibonacci retracements.
You can do this by tracking the standard Fibonacci levels as well as Fibonacci extensions.
Let’s say we have a bullish trend and the price is an impulse move.
In order to trade a potential counter trend move, you would need to know the end of the impulse and the beginning of the corrective move.
To do this, you place the Fibonacci retracement on the previous price counter trend. Then you will use the Fibonacci extensions to identify the potential end for the impulsive price move.
You then apply the rules from the 5 steps discussed above.
Fibonacci retracements can also be useful to confirm when to exit your counter trend trade. You do this by placing the indicator on the previous impulse move. Then you use the standard Fibonacci levels to determine potential support areas for the price action, which you can use to exit your trade.
Let me now show you how to trade counter trend price moves with Fibonacci retracement levels:
Counter Trend Trading – Fibonacci Levels
This is the 3-minute chart of Google, a.k.a. Alphabet Incorporated from July 13, 2016. The image shows how Fibonacci levels help identify the beginning of a counter trend price move.
The prevailing trend of the above price action is bearish. The light blue bearish line on the chart indicates the bearish trend.
First you have a counter trend move, followed by a bearish impulse. The end of the impulse is the beginning of a new counter trend price move, which we attempt to trade.
The colorful areas on the chart are the separate Fibonacci levels. Since we would like to trade the second counter trend, we would need to suggest a potential end for the impulse price move. In this manner, we stretch the Fibonacci levels on the first counter trend on the chart and we use the Fibonacci extension levels to determine a potential end of the bearish impulse.
See that an opposite candle is formed right after the price action touches the 161.8% Fibonacci extension level.
At the same time, this opposite candle is fully engulfed by the previous candle. In this manner, we confirm the presence of a harami reversal pattern on the chart. These are the two steps we need to confirm the pattern and to open a long trade with Google.
However, the bullish signal is even stronger since the price action found support at the 161.8% Fibonacci level. Thus, we buy Google placing a stop loss right below the 161.8% level.
Notice that the price returns to the 161.8% Fibonacci level, where it finds support again. The price then bounces upwards.
Fifteen minutes after we buy Google, the price increases and interacts with the blue bearish trend. This creates an exit signal for our trade and we close the trade collecting a profit.
Remember, Fibonacci levels are suggestive and price will not always conform nicely to the horizontal lines on your chart. If you become too fixated on these levels, you will begin to ignore the obvious price action right before your eyes, which is the key to unlocking when to enter or exit a position.
When to Trade Counter Trend Moves
Counter trend moves are not easy to trade as you are going in the opposite direction of the primary trend. This will result in a number of false trade signals and overall frustration if you are not careful.
To avoid this level of pain, there are a few key points I would like to highlight.
First, avoid extremely volatile stocks. The reason is, if you are wrong on when the counter trend starts, you do not run the risk of having your stop loss tripped.
Second, avoid trading counter trend moves during the first hour of trading. This is when the retail traders are actively looking to close winning or losing positions and the price action often ignores all technical analysis rules.
In this sort of environment, the price action will not conform to the predictable price action required for counter trend moves.
Lastly, focus on trading during the midday. This is when trading volume is light and technical analysis tends to work far greater then times of high volatility.
Full disclosure, I only trade the first hour of trading, so if you figure this one out, please let me know the secret sauce.
Conclusion
When price is trending it creates impulses and counter trends.
Counter trend moves are also known as corrections.
The counter trends are relatively hard to trade, because they make relatively small price moves for the time they take.
Although hard to trade, counter trends also have great trading potential.
To trade a counter trend price move you can simply follow these 5 steps:
Find an opposite candle during an impulse move.
Confirm a reversal candlestick pattern, or another opposite candle.
Open a trade against the primary trend.
Place a stop loss beyond the spike created between the impulse and the emerging correction.
Hold the trade until the price action reaches its trend line.
The Fibonacci retracement is a useful tool for counter trend trading.
What are harmonic patterns in stock trading? Harmonic patterns are used in technical analysis that traders use to find trend reversals. By using indicators like Fibonnaci extensions and retracement...
Fibonacci Arc Definition Fibonacci arc is a technical analysis indicator used to provide hidden support and resistance levels for a security. A Fibonacci arc is constructed by first drawing a trend...
Whether you want to believe it or not, Fibonacci levels play a critical role in defining support and resistance levels when day trading. Not covered much in the trading community is the impact or...

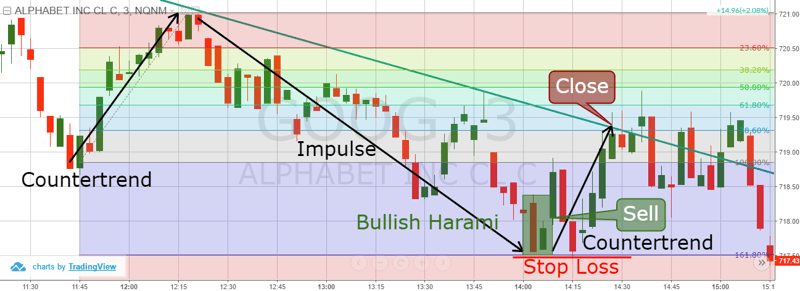

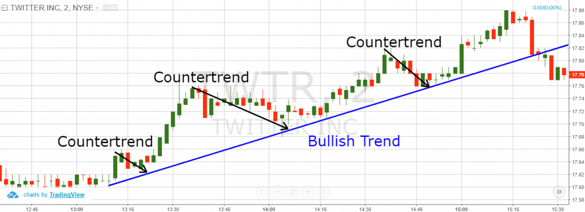
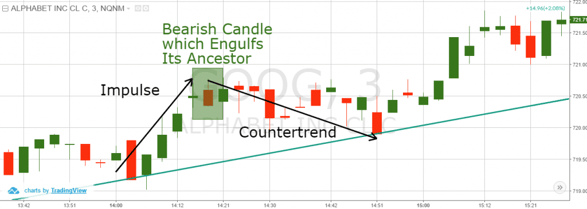
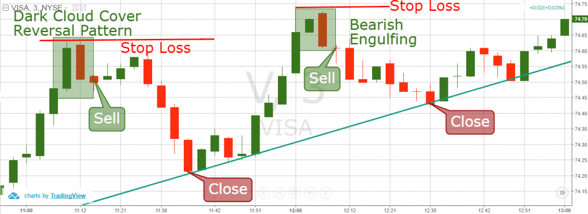


 Chart Patterns


