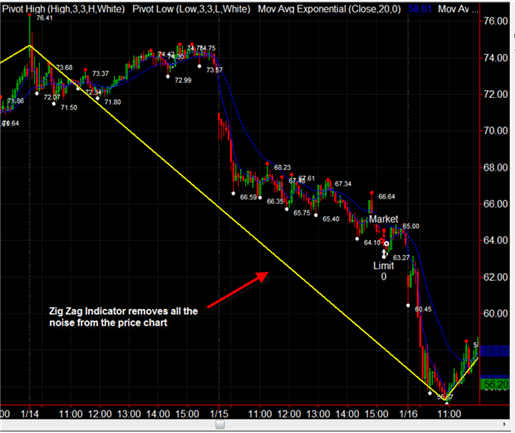
Zig Zag Definition
The zig zag indicator is a bit more serious than its name would imply. The zig zag is a very basic indicator which attempts to reduce the amount of “noise” in a trending security. The aim of the zig zag indicator is to assist traders with staying in a winning position and avoid the urge to close positions on the minor reactions, which are commonplace in the market. Users can set the percentage move that will generate a change in the zig zag signal. The default value for the zig zag is 5%. This means that any counter move less than 5% will not generate a signal on the chart. Hence a trader will be able to ignore the countless minor moves that have no affect on the primary trend.
How to trade using Zig Zag
On first glance the ig Zag appears to be the holy grail of trading, but you have to remember that the values are plotted after the price closes. So, you will want to use the indicator to monitor the health of the primary trend, and not a tool for actively trading the market.
Zig Zag Chart Example
Notice how the Zig Zag line removes the noise from the chart.

Zig Zag Indicator


 Trend Indicators
