Studying the stock market’s past in order to try to predict the stock’s future is referred to as technical analysis.
Trading Options
Trading options are a form of security that you can invest and trade in the stock market. They are securities based on normal stocks. Purchasing an option gives you the right to buy an underlying stock at a specific price at a later date. You profit if the stock market value rises above the agreed price. If the value of the stock crashes, you have only lost your premium.
Options Trading: The information on option trading and how they are traded on exchanges.
Options: A guide on getting started with options.
Welcome to the Technical Analysis Basics Guide: Learn the option trade basics.
Technical vs. Fundamental Analysis
There are two categories used to analyze securities and make investments called technical and fundamental analysis. A fundamental analysis requires research of the market and specific stocks checking if they are undervalued or overpriced. A fundamental analyst looks at the basics of a company to figure fair value. A technical analysis predicts a stock’s price by looking at its past performance. A technical analyst cares more if the public will buy the stock and not what the stock is worth. A technical analyst goes with the moment and trend to find if it will continue to go up or fade down.
Technical Analysis: Introduction: An introduction into technical analysis
Part 1: Introduction to Fundamental Analysis
Technical Analysis vs. Fundamental Analysis: Compare a technical and fundamental analysis.
Fundamental Analysis Vs Technical Analysis: The debate over fundamental and technical analysis.
Understanding a Bar Chart
A bar chart is a basic tool of technical analysis. The financial instruments embedded in bars which are plotted as prices over a specific time period. You can spot a pattern of a stock more easily with a bar chart. A bar is four prices in a given day or time period. It is known as price bar. The price bar displays the opening price as a left horizontal line and the closing price as a right horizontal line. The high price is at the top of the bar and the low price is represented at the bottom of the bar.
Technical Analysis of Commodity Markets: Emphasis on Bar Charts: The emphasis on bar charts.
Learn to Use Currency Trading Bar Charts: Learning how to use currency trading bars.
Technical Analysis-The Bar Chart: Examine the bar chart in technical analysis.
Candlesticks
A candlestick is a chart that displays the high, low, open and close for a security each day over a specified time. There are two basic candlesticks. A Bullish Candle is when the close is higher that open. The color of this candle is usually green or white. A Bearish Candle is when the close is lower than the open. The area in the middle shows the range of the opening and closing prices. When the block in the middle is marked in, the stock closed lower than it opened. This color is usually red or black.
Understanding Forex Trading Bullish Candlestick Charting: Information on how the Forex Trading Bullish candlestick works.
Introduction to Candlesticks: An introduction to the formation and history of candlesticks.
Online Trading Concepts: Learn the basics of the Candlestick.
Technical Analysis of Options
To be successful in your options, you must develop and depend on strategies. Keep in mind of the amount of time it takes for a move, as options lose value over time. Understand the statistics related to the options. Know the percentage of the option along the size of an average option. Avoid being too optimistic. View your options in a conservative way by using strategies with expiration dates.
Option Greeks
An Option Greek measures the options sensitivity to various risk components to the price of an option.
Delta measures the rate change in an option price. An estimation of the change in Delta for a one point move in a stock is called a Gamma. The measure for time decay of an option is called Theta. Measuring the standard deviation of the past 30 days of closing prices in the underlying security is called volatility. A Rho Greek measures an option price due to interests rate shifts.
It is important to understand the terms when it comes to technical analysis. However, you do not have to know how they work. Different software programs can help you learn the terms. Learning from hands on experience is one the best ways to learn from trading.
Call Option vs. Put Option
When you buy a security with an options contract you are purchasing a call option. When you are selling a stock with an option contract you are purchasing a put option
In simpler terms:
Call = Buy
Put = Sell
Sometimes it is very hard to remember these, which is understandable if you are a newbie.
Let me give you a simple method for remembering the difference.
Think of your hand motions when placing a telephone call.
When you want to “call” someone, you lift the handset from the table to your ear. So, the handset goes “up” – in the same direction you need the price to go when you have a call option.
When you finish your phone conversation and you hang up, you “put” the phone down.
Call = Buy (Up)
Put = Sell (Down)
I know that may seem a little silly, but I’m pretty sure you could even explain this to a 5-year old.
Best Technical Indicator for Options Trading
One of the best technical indicators for options trading is the basic trend line.
Traders and investors often say “The trend is your friend!” and “Never trade against the trend!”.
When identifying a trend line, the price needs to conform to the same incline/decline three times in a row. This means that if you see three increasing bottoms on the line, which could be connected with a single line, then you have a bullish trend.
When the price starts decreasing toward our bearish trend line, the expectation is for the price to bounce and create a new bottom off the trend line. This provides us the opportunity to purchase a call option for the security.
Conversely, if you see three decreasing tops on the chart, which could be connected with a single line, then you have a bearish trend right in front of your eyes! Once the stock hits the trend line, this would be an opportunity to purchase a put option.
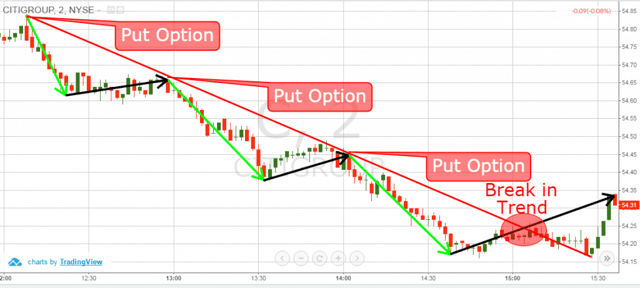
Trend Lines – Options
Above you see a classic example of a bearish trend. This is a 2-minute chart of Citigroup from Nov 23, 2015. The red line indicates the bearish trend of Citigroup. We have four tops on the trend. However, the fourth one indicates the break through the trend, so we disregard it as a potential trade opportunity. Let’s now concentrate on the other three tops.
In an ideal world we will know where the market is going at any time. In this manner, all three swing highs could be traded with a put option as shown in the image above.
Since you now know how options contracts and trends work, let me now introduce you to reality.
As I said, we need to identify three tops lying on the same line in order to confirm a bearish trend. Therefore, we rule out the first two bearish moves, because these lack confirmations.
Then the price creates the third top on the line, which is our requirement for a bearish trend line.
After the stock begins to rollover, this would have been a great opportunity to purchase a put option.
The price drops and we manage to catch a 0.5% price decrease in the equity price.
The problem is that options have a wide spread at times between the bid and the ask. Therefore, while you may have a winning trade in the stock, a .5% move will give you little profit after factoring in commissions and the fact you have to often sell at the bid price.
Now, let’s discuss why being with the trend is better than against the trend. Look again at the bearish trend on the image above. Notice the green and the black arrows. The green arrows indicate the trend moves – the impulses. The black arrows indicate corrective moves against the trend, which lead the price to new interactions with that trend. There are two basic reasons why you shouldn’t trade the moves against the trend:
- They lead to significantly less price change than the trending moves.
- They take approximately the same time to develop as the trending moves.
Options Trading Indicators and Patterns for Increasing Profit
The technical analysis of stock options includes other indicators beyond trend lines.
We will now discuss a couple of on-chart tools, which can provide real-time trading signals.
Volume Indicator
The volume indicator is a tool, which is plotted below the price action.
It shows up price moves in green and down price moves in red.
The thing is that volume will often times have a direct correlation to volatility, which is the cornerstone of options.
When volumes are high, volatility is also high and the stock is trending. When volumes are low, volatility is low and the stock is in a trading range. Have a look at the image below, so you will see what I am referring to:
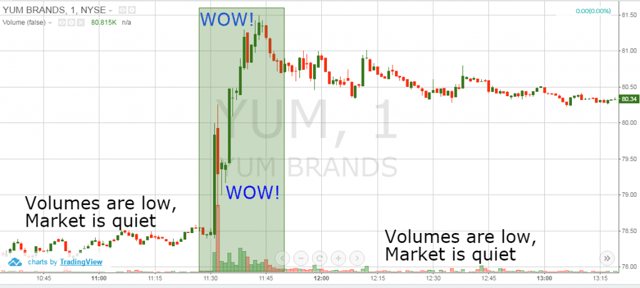
Volume and Options
This is the 1-minute chart of Yum Brands from Mar 23, 2016. At the bottom of the graph we see the volumes indicator.
At the beginning of the chart you see that YUM stock option is ranging on very low trading volumes. Then at 11:30 the YUM trading volumes increase dramatically for 15 minutes. This is when the stock option has a 0.4% jump just in a flash!
Bottom line – to catch trending moves try being in the market when the volumes are high.
Chart Pattern Indicators
Chart patterns are crucial for the technical analysis of stock options. Chart patterns are technical figures created by the price action on the graph. These figures illustrate potential price moves that can be traded.
There are two basic types of chart patterns:
- Trend Continuation Chart Patterns: These are the formations which form during trends and imply that the trend will continue in the same direction. Let me show you some of the most common trend continuation chart patterns.

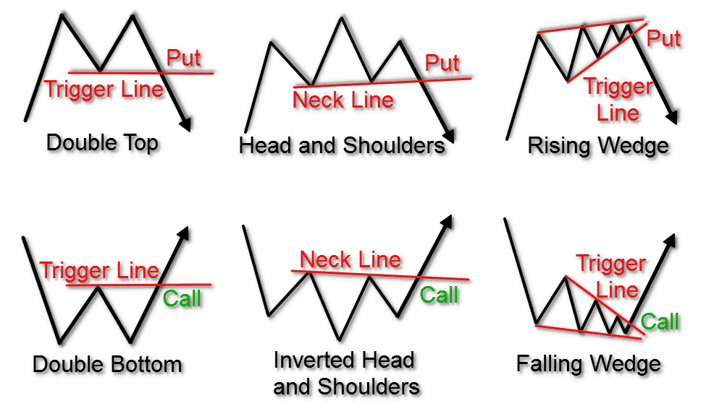
Continuation Chart Patterns
Above you see six of the most traded continuation chart patterns for stock options. The upper three patterns respond to bullish trend continuation. They are mirror image of the lower three patterns, which refer to bearish trend continuation.
We have a trigger line of each pattern. This is the line which gets broken by the price when the pattern is confirmed. In this manner, when the price breaks the trigger, this is a signal to enter the market. So, the upper three patterns should be traded with a call option. Opposite of that, the lower three patterns should be traded with a put option.
When each of these patterns are confirmed, we expect a price move equal to at least the size of the actual pattern.
- Trend Reversal Chart Patterns: These are the figures, which are created at the end of a trend. In this manner, they imply that the trend is at its end and the price is likely to switch directions. Have a look at the image below.
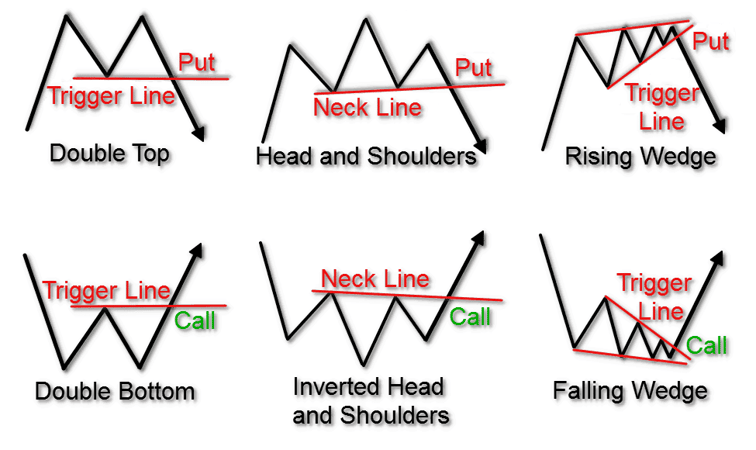
Triggers on Chart Patterns
These are the six most commonly traded reversal chart patterns for stock options. Notice that the upper group a mirror the images from the lower group.
Every chart pattern has a trigger line. When you trade head and shoulders chart patterns, this line is called the “neck”. After all, it is below the head and shoulders, right? When the price breaks the trigger line of each pattern, we expect a price move in the direction of the pattern. Also, the expected move size is likely to be at least as big as the pattern itself.
Notice that the rising and the falling wedge play the role of a trend continuation and trend reversal pattern.
How is that possible?
I will tell you a simple rule to remember: The rising wedge always has bearish potential and the falling wedge always has bullish potential. In the first case the falling wedge comes after a bullish trend. Since the falling wedge has bullish potential, it plays a continuation role in this case.
However, if the falling wedge comes at a bearish trend, it still has bullish potential.
These rules also apply for the rising wedge, just in the opposite direction.
Conclusion
- Options are a financial instrument (contract), which could be traded on equity stocks.
- As with the regular trading, when you analyze an Option chart, you can perform two types of analysis:
- Technical Analysis: It concerns the on-chart price action.
- Fundamental Analysis: It concerns the important financial releases around the respective stock and the economy (industry) it operates in.
- Two of the basic types to display a Stock Option chart are with:
- Bar Charts
- Japanese Candlestick Charts
- The Options Greek indicates the price sensitivity of a Stock Option toward different risk parameters.
- Call Option Contract (Buy) refers to betting that the stock will increase in time. Put Option Contract (Sell) refers to betting that the stock will decrease in time.
- The best options trading technical indicator is the trend line.
- Other technical indicators for stock options trading are:
- Volume Indicator: Volumes are directly related to price volatility. When volumes are high, volatility is also high and price is trending.
- Technical Chart patterns: There are two basic types of Chart Patterns – Trend Continuation Chart Patterns and Trend Reversal Chart Patterns.


 Day Trading Basics


