TEMA stands for Triple Exponential Moving Average and is used to identify trends in the market. It was developed by Patrick Mulloy and was first published in the 1994 issue of Technical Analysis of Stocks and Commodities. Mulloy discovered that by developing a unique composite of a simple exponential moving average, double exponential moving average and a triple exponential moving average, he could reduce the amount of lag between the indicator and price action. The TEMA is a custom indicator and is not included in many trading platforms.
Trading with the Triple Exponential Moving Average
Mulloy discovered that by modifying the MACD to with a TEMA input, it produced better results than the standard MACD, which is based on the exponential moving average.
Triple Exponential Moving Average Formula
Below is the formula for the triple exponential moving average:
(3 * EMA) – (3 * EMA of EMA) + EMA of EMA of EMA)
Where:
EMA = n-day exponential moving average
TEMA
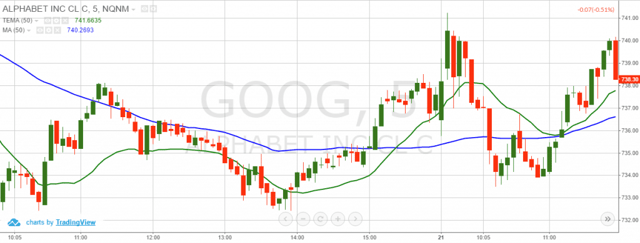
Above is a 5-minute chart which includes a 50-period TEMA and a 50-period SMA.
The green line is the triple EMA and the blue line is the simple moving average. Notice that the two indicators include the same number of periods, but you can see the difference in their plots.
Triple Exponential Moving Average Signals
As you probably guess, the basic signal of the TEMA trading indicator is the same as with any other moving average – the price crossover. When the price breaks the triple exponential moving average, we get an entry or exit signal in the respective direction.
Bearish Cross
We have a bearish TEMA cross when the price closes below the indicator.
If the price breaks the triple exponential moving average in a bearish direction, we get a short signal. This means that any open long trade should be closed. At the same time, short trades should be considered.
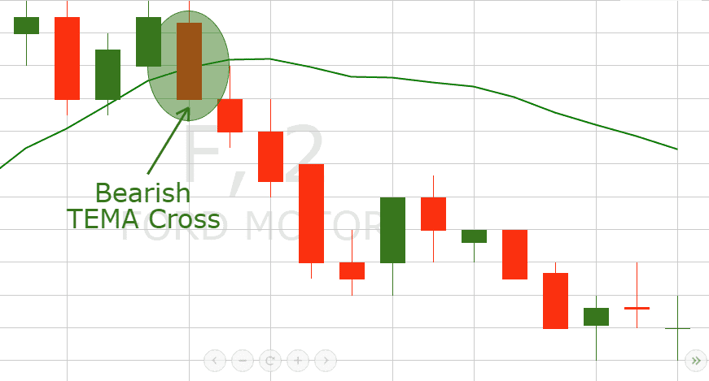
Bearish TEMA Cross
As you see in the above image, the price closes below our triple exponential line. This creates the short signal on the chart.
Bullish Cross
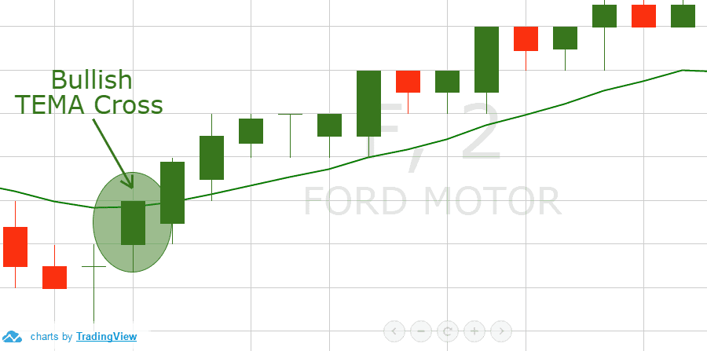
Bullish TEMA Cross
As you see, after the bullish TEMA crossover, the price starts a new increase in the direction of the cross.
TEMA Crosses
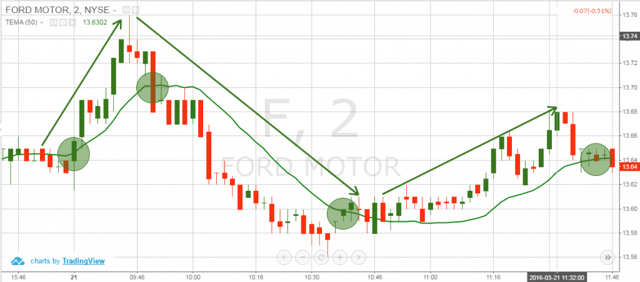
Now you are looking at a 2-minute chart of Ford Motor company. The green line is a 50-period triple EMA where we localize 4 trading signals.
The first signal comes with the first green circle when the price closes a candle above the triple exponential moving average.
The second signal comes after a price correction, which leads to a steady decline. As you see on the chart, there is a big bearish candle, which closes below the TEMA.
At the end of the bearish trend, the price begins to hesitate and then closes above the triple exponential moving average.
Do you have a handle on this yet?
I don’t want to paint this perfect picture, as there are a ton of false signals produced by the market.
For this reason, we will now discuss how to distinguish real TEMA signals from false ones.

Triple Exponential Moving Average Strategy
Now that you are familiar with the TEMA signals, we will discuss a few trading strategies.
A key tenet of the trading strategy is the use of additional trading indicators to filter out false signals.
Triple Exponential Moving Average + Volume Indicator
This is a classical setup where we combine the TEMA trading instrument with a good ole volume indicator.
The idea of this strategy is to take signals that include high trading volumes.
As you probably know, the market is trending when volumes are high.
During low volumes, prices are likely to range and not trend. This means that low volumes are the major cause for the sideways price action.
For this reason, triple exponential moving average signals, which appear during lower trading volumes tend to fail.
For this strategy, we will enter the market only when TEMA price crossovers with higher trading volumes.
We will then hold our trades until the price action breaks the triple exponential moving average in the opposite direction.
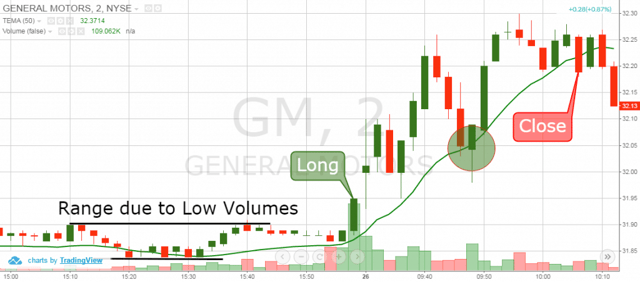
TEMA + Volume
Above is the 2-minute chart of General Motors from Apr 26, 2016. The green line on the chart is the 50-period triple EMA. The red and green bars at the bottom of the chart are our volume indicator.
The chart starts with a range consisting of light volume. Notice that for the crosses beneath and above the TEMA, we ignore these signals, due to the light volume.
Suddenly, volumes in GM begin to increase and the price forms a bigger bullish candle.
At the same time, the price begins to move above the triple exponential moving average and the bullish candle imply that this trend is likely to be bullish. Therefore, we open a bullish trade with the closing of the bullish candle as shown on the image.
The price continues higher after opening the position.
The first correction of the bullish move tests the area of the 50-period TEMA but the price is able to hold up under the selling pressure.
The second correction actually breaches the TEMA, but the price was unable to close beneath the TEMA.
Therefore, this signal should be disregarded. GM then makes one final push higher and ultimately closes beneath the TEMA.
Once the price closes beneath the TEMA, we would need to exit the position.
TEMA + Volume Weighted Moving Average (VWMA)
The VWMA acts as a standard moving average on the chart. The difference between the VWMA and the simple moving average is that the VWMA places emphasize periods with higher trading volume. This makes it the perfect tool to combine with the TEMA.
We will use the same 50-period TEMA in a combination with a 25-period VWMA (TEMA/2). We will open trades only when the TEMA and the VWMA cross. The trades should be in the direction of the crossover. We will hold each trade until the price action breaks the volume weighted MA in the opposite direction.
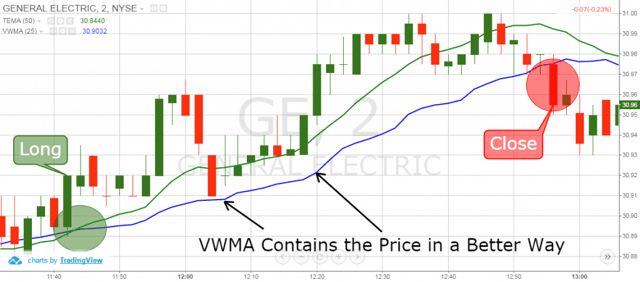
TEMA + VWMA
Above is the 2-minute chart of General Electric from Apr 27, 2016.
The green line on the graph is the 50-period TEMA. The blue line is the 25-period VWMA. The image illustrates a long trade with the GE stock, taken by signals from the TEMA and the VWMA.
The chart above starts with a price increase and a bullish crossover between the two indicators. This generates a long signal between the triple EMA and the volume weighted MA. Following our strategy, we open a long position.
The correction which comes after the second price impulse brings the price below the triple exponential moving average.
However, the VWMA is still untouched. Following our strategy’s exit rules, we hold the trade until the price closes a candle below the VWMA.
Notice, in this case, the TEMA fails to provide a reliable exit signal. The VWMA, on the other hand, contains the price in a better way than the TEMA. The reason for this is that the VWMA indicator is a volume-based moving average. In this manner, the indicator gains additional inclination when volumes are higher.
This is how the VWMA indicator adapts to the dynamic moves on the chart.
The next price action leads to a new increase and the GE stock reaches the highest point of its bullish trend.
The stock then enters a corrective phase. On the way down, General Electric breaks the triple exponential moving average line.
Even though we had a break, we stay until we see a breakout in the volume weighted line. This happens 16 minutes later when a bigger bearish candle appears on the chart. We get a valid exit signal and we close our long trade on the GE stock.
Which is the Best Triple Exponential Moving Average Strategy
I believe this would be the second strategy – TEMA + VWMA. The reason for this is that the VWMA gives all the additional data we need to enter a trade. This is average price and volumes reaction.
The TEMA plus the volume indicator is another strategy for trading with TEMA; however, the entry signals are sometimes hard to determine. The reason for this is that in many cases, volumes might be confusing. If the volume bar is somewhere in the middle, is the trading volume low, or high? This sometimes confuses and fails the traders who attempt to enter a position.
Conclusion
- The Triple Exponential Moving Average was developed by Patrick Mulloy.
- TEMA helps you identify trends.
- The TEMA is a triple-smoothed exponential moving average, which reduces the lag between the indicator and the price action.
- TEMA is a custom setup, which is missing in many trading platforms.
- The basic TEMA signals are:
- Bullish Crossover: A candle is closed from the upper side of the TEMA line
- Bearish Crossover: A candle is closed from the lower side of the TEMA line
- Two of the best TEMA trading strategies are:
- TEMA + Volume Indicator: We enter trades on TEMA crossover + higher volumes. We exit trades when price breaks TEMA in the opposite direction.
- TEMA + VWMA: We enter trades on TEMA and VWMA crossovers in the direction of the cross. We exit trades when price breaks the VWMA in the opposite direction.


 Day Trading Indicators


