Swing High and Swing Low: Trend Trading Guide [Updated April 2026]
Apr 19, 2026
Written by: Al Hill
✓ Reviewed by Kunal Vakil, Co-Founder of TradingSim · Updated Apr 19, 2026
Swing high and swing low; you might have heard the term being used many times, especially among day traders. If you have been confused by what this term means, then this article will explain what they are. By the end of the article you would be able to identify swing high and swing low points, and hopefully incorporate these strategies into your playbook.
Why swing highs and lows?
Price seldom moves in one direction. Pull up any chart across any market and you will undoubtedly see the zig-zag fashion. As price tends to flip-flop as it trends higher or lower, you are seeing the swing highs and lows forming.
As a day trader, swing high and swing low can reveal important market information. When you understand how to use this information, you can easily play with different trading strategies. With swing high and swing low you can ride the trend or even trade the market that is stuck in a range.
Swing high and swing low are common to all charts and therefore, the concept can be applied to any market. What’s even better is the fact that swing high and low can be applied to any time frame. What this means for you is that, understanding how swing high and swing low works enables you to swing trade or day trade the markets.
Another aspect to bear in mind is the fractal nature of the swing high and swing low points. Whether you look at a 5-minute chart or a weekly chart time frame, swing highs and swing lows are easily identifiable.
What is a fractal you might ask?
Well, fractal is defined as a curve or a geometric figure, according to this entry on Wikipedia. Each part has the same statistical character. It is a pattern that repeats itself. A good example is that of a snowflake where the fractal pattern occurs as you zoom in.
Undoubtedly, there is a lot of math involved and there is a specialized field in the study of fractals. This research article gives a basic insight into fractal geometry. It would be worth a read as it talks about the basics of fractals so you have a better understanding.
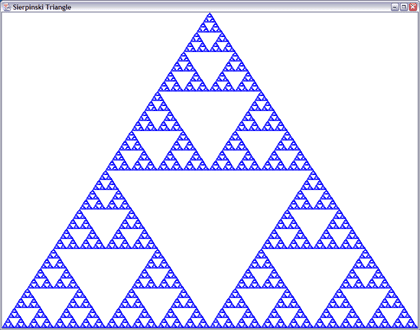
Example of fractal geometry – The Sierpinski Triangle
You can see from the above figure how the triangle pattern is repeated when you zoom in. In other words, the larger triangle is made up of multiple smaller triangles in the same fashion.
Now that we know what a fractal is, let’s move on to explaining what a swing high and swing low is.
So let’s start with the very basics.
What is a swing high and swing low?
The text book definition for a swing high and a swing low is as follows:
A swing low is when price makes a low and is immediately followed by two consecutive higher lows. Likewise, a swing high is when price makes a high and is followed by two consecutive lower highs.
The first chart below shows this definition in action on the price chart.
Example of a Swing high and swing low
What you see in the chart is a 5-minute chart for APPL. The flags at the top and the bottom show the swing high and swing low.
The flags depict the point when price makes a swing high or a swing low. Following the high and the low, the next subsequent sessions form a two consecutive lower high or a higher low. The above is an example of a very microscopic look at the swing high and swing low.
For intraday traders, the above chart can reveal quite some information. For example, starting with the first flat on the left side, you can see that after the swing low is formed, price tends to move higher. This tells you that the market is trend higher.
What’s more! The second swing low marked by the flag shows that it is a higher low compared to the first flag.
Now if you look close enough, you will see that the swing highs identified by the fourth and sixth flag are formed almost at the same price level. Subsequently, price tends to make swing highs and lows, each of which is higher than the previous one.
Capturing trends with swing high and swing low
This pattern tells you that price is in an uptrend. However, as you might figure out, this is only in hindsight. So how can we capture the uptrend as price tends to make higher highs and lower lows?
You simply look at the swing highs and the swing lows. Now let’s add a moving average to the chart above to get a better picture.
Swing high and low and the moving average to understand trends
Now the trend is clear when you look at the 10-period moving average. This is nothing but using swing high and swing low in order to understand the trend. The advantage of using the swing high and swing low is that you are able to define the trend by just looking at these patterns.
But you might be wondering why a swing high and swing low is formed in the first place.
Why are swing high and swing low formed?
A swing high and swing low is formed due to what is known as support and resistance. The technical explanation for support and resistance is as follows.
A support forms for the price when you notice that there are more buyers than sellers at a certain price. The demand for the asset or the stock overwhelms the supply and thus pushes price higher.
A resistance forms for price when you notice more sellers than buyers at the price level. In this case, price fails to move higher and therefore declines.
In the next chart below, the support and resistance levels are shown, which also coincides with the swing high and low.
Swing high and low identified by the support and resistance levels
When price breaches previous swing low or high point and follows up with another swing high or a swing low, price continues the trend. To put this in perspective, when price breaks the resistance level and forms a swing low, it means that buyers are in control. Similarly, when price breaks the support level and forms a swing high, it means that sellers are in control.
Now that we know the basic principles behind swing high and low, let’s look at how you can use this to improve your trading.
How to use swing high and swing low in your trading?
There are many ways to use the swing high and swing low in your day to day trading strategies. For one, the swing high and low method can be applied to identifying the trends in the market. You can also make use of the swing high and low based on the larger time frame.
In other words, instead of using the basic definition of swing high and swing low, you can identify the turning points based on a larger time scale.
The chart below shows a one-hour chart time frame for APPL.
Here, instead of using the swing high and low based on a session or a candlestick basis, we simply identify the swing high and swing low points on a larger time frame.
Swing high and low on a one-hour chart
In the above example, you can see that the swing highs and lows are formed over a series of candlesticks or sessions. Using this method will help you to identify the trends and trade in the direction of the trend.
For example, the first four swing highs on the above chart indicate that price action is in a downtrend. However, after the swing low is formed, you can see that subsequent swing lows tend to post higher lows.
Eventually, price action starts to move higher and you can see that the trend changes direction. This is evident from the third swing low that forms above the previous swing high point around the 187.00 price level.
Using the above information you can easily trade the downtrend or even the uptrend when the direction changes.
The swing high and swing low also alerts you to potential breaks of support and resistance levels. This enables you to ride the momentum in price action.
Trend trading with swing high and swing low
As mentioned earlier, you can trade the trends with ease using the swing high and swing low method. You can apply other trend trading strategies as well using this method. Let’s take a look at the below example on how we can use a simple oscillator along with the swing high and swing low method.
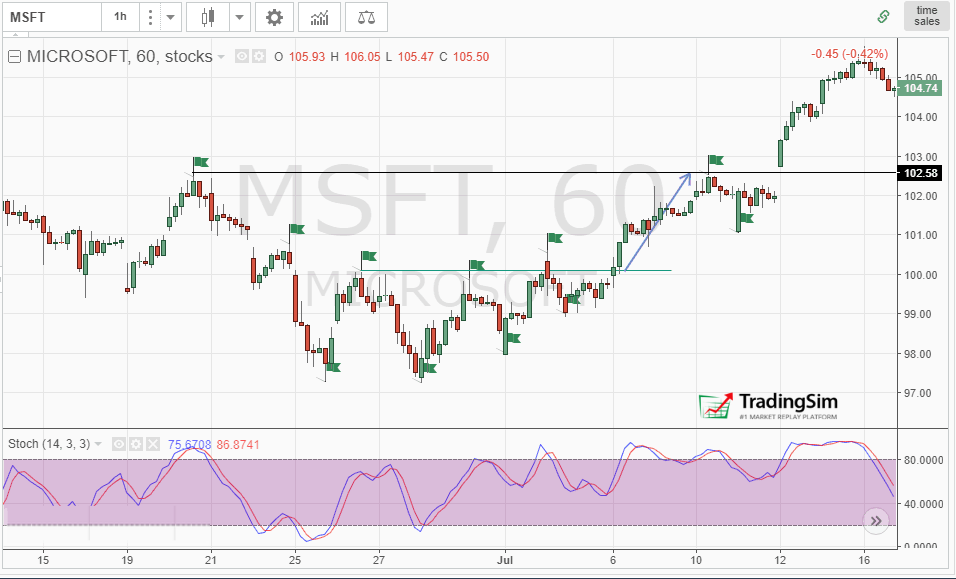
The chart below you see is for MSFT, 1 hour chart. We only add the Stochastics oscillator with the default period settings of 14, 3, 3.
Trading with Swing high and Swing low
In the above chart, the usual swing high and swing low points are plotted on the chart. You can see that after price forms a bottom, the swing highs are formed around the same price level.
Similarly, the lows in price action show that price forms a swing low near the same area. After this bottom formation, price action starts to move gradually higher. This is evident from the fact that the swing lows start to post higher lows.
Eventually, price breaks the resistance level of 100.00. Just prior to this price action, you can see another (third) swing low being formed. By this you already can see that price is in a clear uptrend. Buying on the break above the resistance level would give you a chance to ride the uptrend.
The first profit can be booked near the previous swing high of 102.58, while leaving the rest of the position open and by covering the risk.
The above method is just a simple way to trade the trend by merely using the concept of swing high and swing low and an oscillator. You can also use this method with other indicators such as Bollinger bands or making use of overbought or oversold levels.
Why use the swing high and swing low method?
The swing high and swing low method as demonstrated above shows you how to capture the small but very significant movements in price action. The swing high and low methods can help you to identify mainly the support and resistance levels.
Using this information which can be applied to any chart and time frame, traders can easily build or improve their trading strategies.
Quick answer (updated April 2026)
A swing high is a price peak that has at least two lower highs to its left and two lower highs to its right on the chart. A swing low is the mirror: a trough with at least two higher lows on each side. Together, swing highs and lows define market structure — the sequence of higher highs and higher lows that defines an uptrend, or lower highs and lower lows that defines a downtrend.
How to identify a swing high in 3 steps
Find a peak. Pick any candle whose high is higher than the candles immediately to its left.
Confirm with two bars right. The two candles to the right of the peak must both have lower highs. If not, the swing high has not yet confirmed.
Mark the level. Draw a horizontal line at the high. That level becomes future resistance and a reference for trailing stops.
Why swing highs and lows matter for trend trading
Trend traders enter on pullbacks to a prior swing low (in an uptrend) or a prior swing high (in a downtrend) and exit when structure breaks. A confirmed lower swing high inside an uptrend is the first signal that demand is fading. A higher swing low inside a downtrend is the first signal that selling pressure is exhausting.
Drill swing-high entries in a simulator
Spotting confirmed swing structure on a live chart is a skill that comes with reps. Inside the TradingSim stock trading simulator, replay any uptrending stock and pause at each pullback to a prior swing low — then run the tape forward to see whether the bounce held. After 30-50 reps, the pattern becomes obvious in real time. Futures traders can practice the same structure on /ES, /NQ, and /CL inside the TradingSim futures simulator.
Swing high and swing low FAQ
What is a swing high in trading?
A swing high is a peak on the chart that has at least two candles with lower highs on either side. It marks a short-term reversal in price and becomes a reference level for resistance and trailing stops.
What is a swing low?
A swing low is a trough that has at least two candles with higher lows on either side. It marks a short-term low and acts as a reference level for support and stop placement.
How many bars define a swing high?
The standard definition uses 2 bars on each side (a 5-bar swing). Stricter traders use 3 or 5 bars on each side for higher-timeframe charts. The more bars required, the fewer but stronger swings.
How do swing highs and lows define a trend?
A series of higher swing highs paired with higher swing lows defines an uptrend. Lower swing highs paired with lower swing lows defines a downtrend. When the sequence breaks (e.g., a lower swing high inside an uptrend), the trend is at risk.
Can you use swing highs for stop placement?
Yes. In a long trade, place the protective stop just below the most recent confirmed swing low. In a short trade, place the stop just above the most recent confirmed swing high. As price extends, trail the stop to each new swing.
Alton Hill is the Co-Founder of TradingSim with over 18 years of trading experience. He completed the Design Thinking Bootcamp at Stanford’s D.School and brings expertise in Product Development to create the best trading simulation experience. His strategy focuses on trend-following systems, targeting high-volatility stocks with strong primary trends using the 15-minute chart.
Overview of Swing Trading Swing trading strategies is a form of active trading. The goal is to make a profit on a trade from a time span as short as a few days to a few months. You can place trades...
Day trading is defined as an approach to trading where the trader opens and closes the trade during the same trading day. Day trading is sometimes referred to also as scalping or intra-day trading....
Day Trading vs Swing Trading: Which Strategy Suits You Best?
Day Trading vs Swing Trading — Which One Aligns Best With Your Goals for Profitability, Time, Capital, and Risk? Day trading and swing trading are the two primary short-term styles active traders use...


.png?width=720&height=405&name=swing-high-swing-low%20(1).png)
.png?width=720&height=431&name=swing-high-low-trends%20(1).png)
.png?width=720&height=435&name=swing-high-low-support-resistance%20(1).png)
.png?width=720&height=433&name=AAPL-Swing-High-and-Low%20(1).png)


 Investing


