The relative strength index (RSI) is one of the most popular oscillators in all of trading. You have likely read some general articles on the RSI in your trading career, or have at least heard about it. However, in this post, we’ll present four unique, profitable RSI trading strategies you can use when trading.
Before we dive into the RSI trading strategies, let’s first ground ourselves on the basics of the RSI indicator. Then, we’ll provide you with a few relatively unknown techniques.
Relative Strength Index Definition
The Relative Strength Index (RSI) is a basic measure of how well a stock is performing against itself by comparing the strength of the up days versus the down days. This number is computed and has a range between 0 and 100.
A reading above 70 is considered bullish, while a reading below 30 is an indication of bearishness. Generally speaking, it helps to measure periods of overbought or oversold conditions.
Why the RSI?
As traders, our job is to look for an edge in the market. Indicators can certainly help with this if used correctly.
The RSI is no different. When used properly, it can help predict rising momentum, underlying demand or supply, and shifts in sentiment.
Using the indicator can also help predict trends, trend reversals, trend continuations, or stagnate corrections.
With practice, and in combination with a firm understanding of volume and price action, the RSI indicator can simply be a helpful tool in your trading arsenal.
We certainly don’t recommend doing these calculations while you’re trading. After all, most charting platforms have an RSI indicator that does all the math for you.
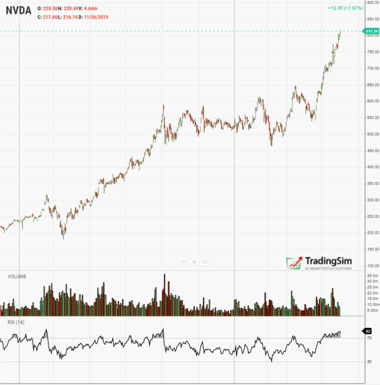
The result is a plot on subchart that indicates the oversold and overbought conditions, like the one below this chart in this example:
NVDA RSI chart
How NOT To Use the Formula
Most traders use the relative strength index simply by buying a stock when the indicator hits 30 and selling when it hits 70. You can see these levels on the RSI indicator above.
However, if you remember anything from this article, remember that if you buy and sell based on this relative strength index trading strategy alone, “YOU WILL LOSE MONEY”.
The market does not reward anyone for trading the obvious. Now that doesn’t mean that simple methods don’t work. But simple methods that everyone else is following typically have low odds.
With that in mind, let’s discuss how to properly use this dynamic formula.
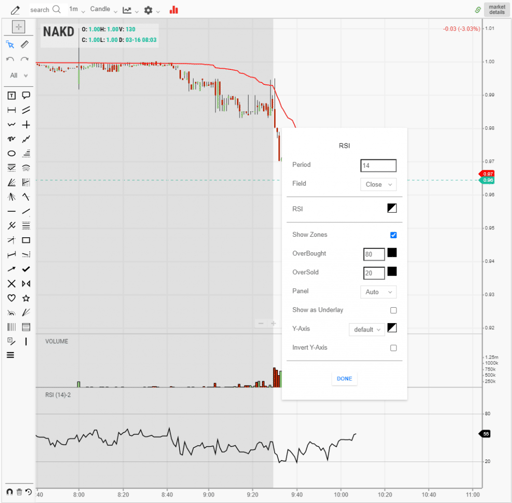
Finding RSI Indicator Settings
For every platform, the settings may be different. However, most platforms should have an RSI indicator.
Once you find the RSI indicator in your platform’s indicator index, you can edit the settings according to whichever relative strength index trading strategy you want to employ.
RSI Indicator Settings
In the screenshot above, you can see inside the TradingSim RSI settings. The default parameters are usually set for a 14 period and 80/20 upper and lower threshold.
Within, you can change the period from the standard 14 to whatever you prefer. You can also change the “overbought” and “oversold” parameters as you wish.
To that point, we’ll discuss different RSI trading strategies that may require you to modify these settings.
How to Use RSI Trade Signals
The RSI provides several signals to traders. In this next section we’ll explore the various trade setups using the indicator.
Defining the Current Trend
The RSI is much more than a buy and sell signal indicator. The RSI can provide you with the ability to gauge the primary direction of the trend.
So how do we do this?
First, we define the range where the RSI can track bull and bear markets.
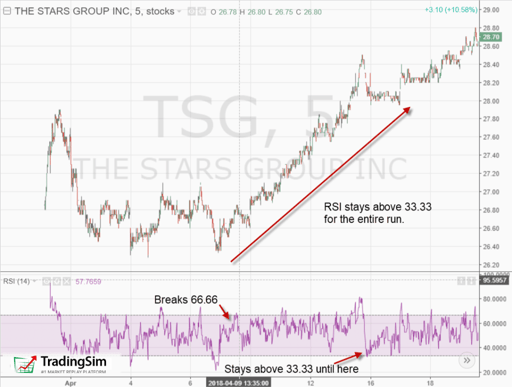
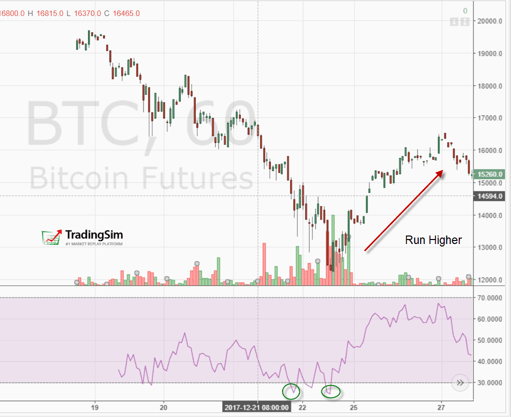
Uptrends
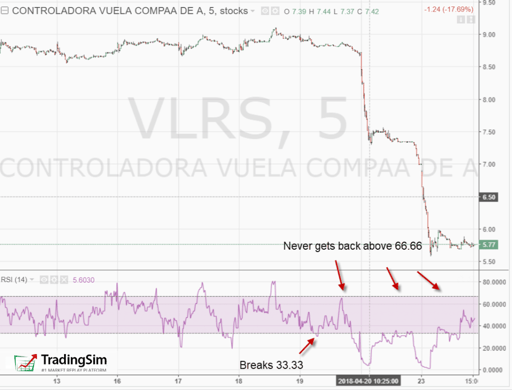
For bull markets, you want to be on the lookout for signals of 66.66 and bear markets at 33.33 [2].
John theorizes throughout the book that these levels are the true numbers that measure bull and bear trends and not the standard extreme readings.
RSI Defining Trend
Again, the RSI is not just about buy and sell signals. The indicator is about showing “strength,” particularly as a measure of the strength of the trend.
In the above chart example, the RSI shifted from a weak position to over 66.66. From this point, the RSI stayed above the 33.33 level for days and would have kept you long in the market for the entire run.
Downtrends
As you can see below, the RSI can also define downtrends. You just want to make sure the security does not cross 66.66.
Defining Downtrend
Now, should you make buy or sell signals based on crosses of 33.33 and 66.66? Not too fast, there is more to the RSI indicator which we will now dive into.
RSI Support and Resistance
Did you know the RSI can display the actual support and resistance levels in the market? These support and resistance lines can come in the form of horizontal zones, or as we will illustrate shortly, sloping trendlines.
Breakouts
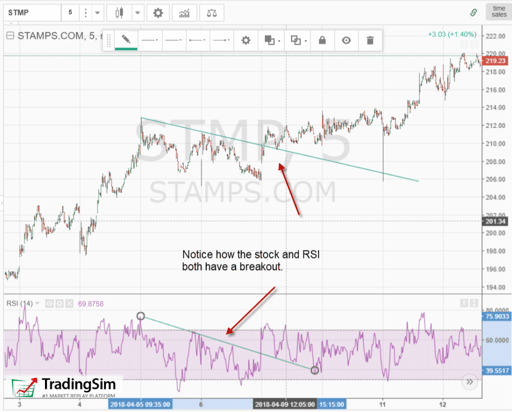
In the example below, the RSI predicts a breakout.
RSI Breakout
You may not know this, but you can apply trend lines to indicators in the same manner as price charts. In the above chart, Stamps.com was able to jump significant resistance on the RSI indicator and the price chart.
This breakout resulted in a nice run of over 7%.
Breakdowns
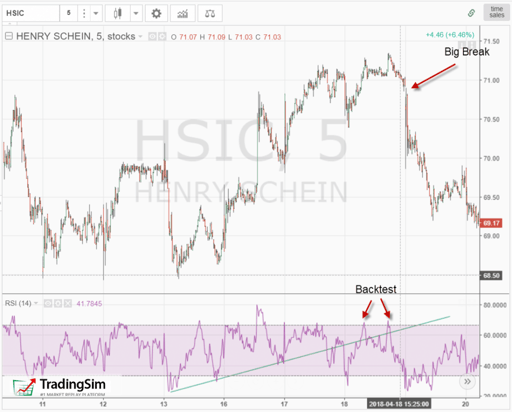
Let’s take a look at another example. This time, the RSI was able to call a top.
In this example, the RSI had a breakdown and backtest of the trendline before the fall in price. While the stock continued to make higher highs, the RSI was starting to slump.
RSI Trend Breakdown
The challenging part of this method is identifying when a trendline break in the indicator will lead to a major shift in price. As expected, you may have several false signals before the big move.
There is no such thing as easy money in the market. It only becomes easy after you have become a master of your craft.
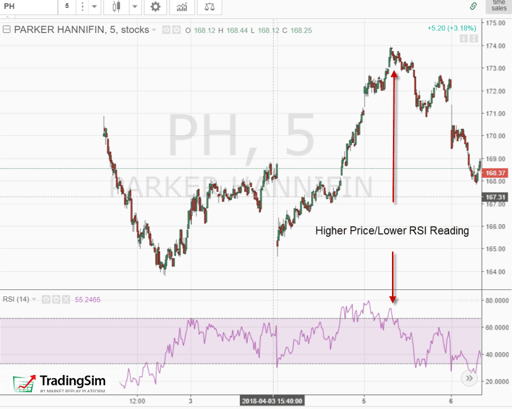
RSI Divergence with Price
This is an oldie but goodie, and is still applicable to the RSI indicator. Building upon the example from the last section, you want to identify times where price is making new highs, but the Relative Strength Indicator is unable to make new highs.
RSI Divergence
This is a clear example where the indicator is starting to roll as the price inches higher.
RSI Double Bottom Signal
The Relative Strength Index can also be used for typical patterns like double bottoms.
For the example below, the first price bottom is made on heavy volume. This occurs after the security has been in a strong uptrend for some period.
Note that the RSI has been above 30 for a considerable amount of time. Nonetheless, after the first price sell-off, which also results in a breach of 30 on the RSI, the stock also has a snapback rally.
Double Bottom
This rally is short lived and is then followed by another pullback, which breaks the low of the first bottom.
This second low is where stops are raided from the first reaction low. Shortly after breaking the low by a few ticks, the security begins to rally sharply.
Consequently, the second low not only forms a double bottom on the price chart but the relative strength index as well.
The reason this second rally has strength is (1) the weak longs were stopped out of their position on the second reaction, and (2) the new shorts are being squeezed out of their position.
The combination of these two forces produces sharp rallies in a very short time frame.
Exercise Caution
The tricky part about finding these double bottoms is timing. After the formation completes, the security may be much higher.
You are going to need tight stops to avoid ending up on the wrong side of the trade.
As mentioned earlier, it is easy to see these setups and assume they will all work. What people do not tell you is that for every one of these charts that play out nicely, there are countless others that fail.
It only takes one trader with enough capital and conviction to make mincemeat out of your nice charts and trendlines.
To that point, be sure to test your RSI trading strategies in a simulator first. This way you have an understanding of your probability for success.
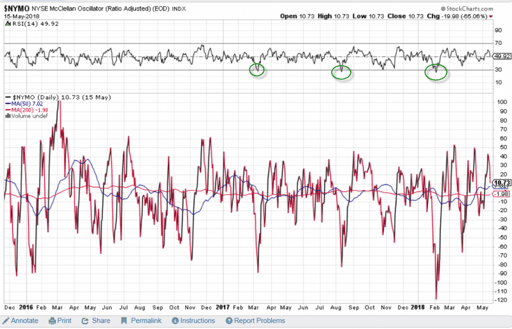
RSI and the Broad Market
If you want to assess the broader market, there is an interesting approach of applying the RSI to the McClellan Oscillator.
This won’t help you much day trading, as this sort of weakness in the broad market only occurs a few times a year.
However, if you are in the middle of a day trade, it might prepare you for the tidal wave that’s coming.
It’s amazing how applying a strength measurement to a broad market indicator can reveal when weakness hits a tipping point.
If you find this interesting, here is a post that analyzed the return of the broad market since 1950 after the RSI hit extreme readings of 30 and 70.
In the post [3], senior quantitative analyst Rocky White makes the case that over the short-term after a reading below 30, the bears are still in control. However, if you look a little further to the intermediate-term, the bulls will surface and a long move is in play.
Trading Strategies Using the Relative Strength Index Indicator
Although the RSI is an effective tool, it is always better to combine it with other technical indicators to validate trading decisions. The relative strength index trading strategies we will cover in the next section will show you how to reduce the number of false signals so prevalent in the market.
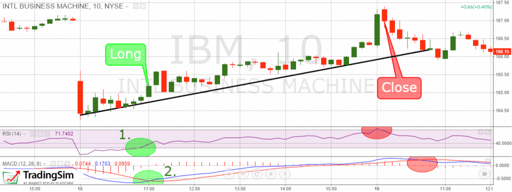
#1 – RSI + MACD
In this trading strategy, we will combine the RSI indicator with the very popular MACD.
In short, we enter the market whenever we receive an overbought or oversold signal from the RSI supported by the MACD. We close our position if either indicator provides an exit signal.
Example
This is the 10-minute chart of IBM. In this relative strength index example, the green circles show the moments where we receive entry signals from both indicators. The red circles denote our exit points.
Relative Strength Index + MACD
Slightly more than an hour after the morning open, we notice the relative strength index leaving an oversold condition, which is a clear buy signal. The next period, we see the MACD perform a bullish crossover – our second signal.
Since we have two matching signals from the indicators, we go long with IBM. We appear to be at the beginning of a steady bullish trend.
Five hours later, we see the RSI entering oversold territory just for a moment. Since our strategy only needs one sell signal, we close the trade based on the RSI oversold reading.
This position generated $2.08 profit per share for approximately 6 hours of work.
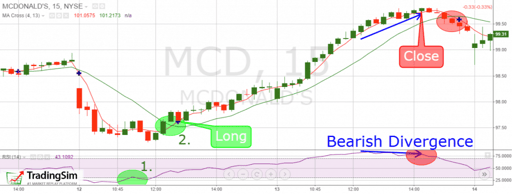
#2 – RSI + MA Cross
In this trading strategy, we will match the RSI with the moving average cross indicator. For the moving averages, we will use the 4-period and 13-period MAs.
We will buy or sell the stock when we match an RSI overbought or oversold signal with a supportive crossover of the moving averages. On that token, we will hold the position until we get the opposite signal from one of the two indicators or divergence on the chart.
First, let’s clarify something about the MA cross exit signals.
A regular crossover from the moving average is not enough to exit a trade. We recommend waiting for a candle to close beyond both lines of the moving average cross before exiting the market.
Example
To illustrate this RSI trading strategy, please have a look at the chart below:
Moving Average Cross Divergence
This is the 15-minute chart of McDonald’s.
The RSI enters the oversold area with the bearish gap the morning of Aug 12. Two hours later, the RSI line exits the oversold territory generating a buy signal.
An hour and a half later, the MA has a bullish cross, giving us a second long signal. Therefore, we buy McDonald’s as a result of two matching signals between the RSI and the MA Cross. McDonald’s then enters a strong bullish trend, and 4 hours later, the RSI enters the overbought zone.
At the end of the trading day, we spot a bearish divergence between the RSI and McDonald’s price. Furthermore, this happens in the overbought area of the RSI. This is a very strong exit signal, and we immediately close our long trade.
This is a clear example of how we can attain an extra signal from the RSI by using divergence as an exit signal. This long position with MCD made us a profit of $2.05 per share.
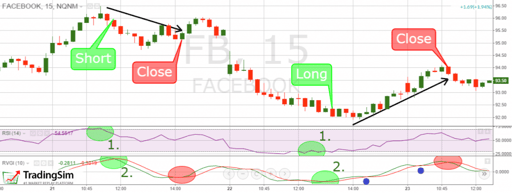
#3 – RSI + RVI
For this RSI trading strategy, we’ll combine the relative strength index with the relative vigor index.
In this setup, you will enter the market only when you have matching signals from both indicators. Hold the position until you get an opposite signal from one of the tools – pretty straightforward.
Example
This is the 15-minute chart of Facebook. In this example, we take two positions in Facebook.
Relative Strength Index – RVI
First, we get an overbought signal from the RSI. Then the RSI line breaks to the downside, giving us the first short signal.
Two periods later, the RVI lines have a bearish cross. This is the second bearish signal we need and we short Facebook, at which point the stock begins to drop.
After a slight counter move, the RVI lines have a bullish cross, which is highlighted in the second red circle and we close our short position. This trade generated a profit of 77 cents per share for a little over 2 hours of work.
Facebook then starts a new bearish move slightly after 2 pm on the 21st. Unfortunately, the two indicators are not saying the same thing, so we stay out of the market.
Later the RSI enters the oversold territory. A few periods later, the RSI generates a bullish signal.
Relative Strength Index – RVI
After two periods, the RVI lines also have a bullish cross, which is our second signal and we take a long position in Facebook. Just an hour later, the price starts to trend upwards.
Notice that during the price increase, the RVI lines attempt a bearish crossover, which is represented with the two blue dots.
Fortunately, these attempts are unsuccessful, and we stay with our long trade. Later the RVI finally has a bearish cross, and we close our trade. This long position with FB accumulated $2.01 per share for 4 hours.
In total, the RSI + RVI strategy on Facebook generated $2.78 per share.
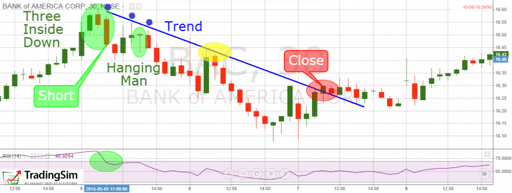
#4 – RSI + Price Action Trading
For this strategy, we’ll use the relative strength index overbought and oversold signal in combination with any price action indication, such as candlesticks, chart patterns, trend lines, channels, etc.
To enter a trade, you will need an RSI signal plus a price action signal – candle pattern, chart pattern or breakout. The goal is to hold every trade until a contrary RSI signal presents, or price movement confirms that the move is over.
Price Action Trading Strategy
This is the 30-minute chart of Bank of America.
The chart starts with the RSI in overbought territory. After an uptrend, BAC draws the famous three inside down candle pattern, which has a strong bearish potential.
With the confirmation of the pattern, we see the RSI also breaking down through the overbought area.
With matching bearish signals, we short BAC.
The price starts a slight increase afterward. Perhap we wonder if we should close the trade or not. Fortunately, we spot a hanging man candle, which has a bearish context.
We hold our trade and the price drops again.
Notice the three blue dots on the image. These simple dots are enough to confirm our downtrend line. After we entered the market on an RSI signal and a candle pattern, we now have an established bearish trend to follow!
Later on, the trend resists the price rally (yellow circle), and we see another drop in our favor. After this decrease, BAC breaks the bearish trend, which gives us an exit signal.
We close our position with BAC, and we collect our profit. This trade made us 20 cents per share.
Which Trading Strategy Is Best?
If you are new to trading, combining the relative strength index with another indicator like volume or moving averages is likely a great start.
Pairing with the indicator will give you a set value with you can make a decision. It also removes a lot of the gray areas associated with trading.
Once you progress in your trading career, you may want to look to methods using price action that are more subjective. At this point, you may be able to apply techniques specific to the security you are trading, which could increase your winning percentages over time.
But again, this level of trading takes a ton of practice over an extended period.
Examples of where the Relative Strength Indicator Fails
I think it’s important to highlight where indicators can fail you as a trader and the RSI is no different.
At best you may achieve a 60% win rate with any strategy, including one with the RSI.
With that in mind, let’s layout the likely ways the RSI could burn you when trading.
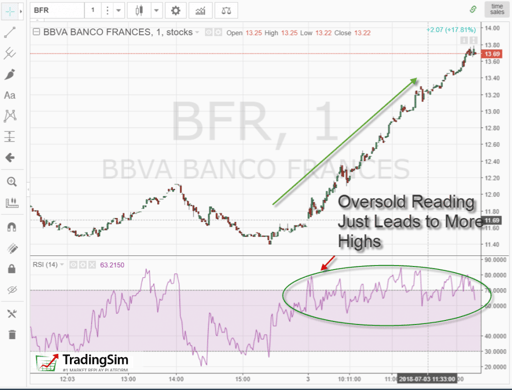
#1 – The Stock Keeps Trending
The textbook picture of an oversold or overbought RSI reading will lead to a perfect turning point in the stock. This is what you will see on many sites and is even mentioned earlier in this very post.
However, we all know things rarely go as planned in the market.
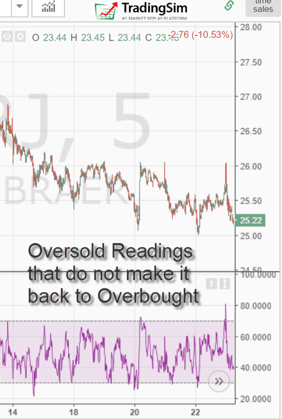
False Sell Signals
As you see, there were multiple times that BFR gave oversold signals using the relative strength indicator. The stock continued higher for over three hours.
So how do you avoid such an unfortunate event if you are going short in the market?
Simple, you have to include a stop loss in your trade. This will be a common theme as we continue to dissect how the RSI can fail you.
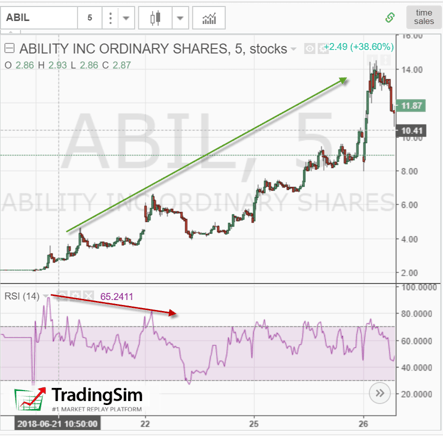
#2 – Divergences Do Not Always Lead to Meltdowns
The tricky thing about divergences is that the reading on the RSI is set by price action for that respective swing.
Unfortunately, there are times where the price action itself changes from one of impulse to a slow grind.
Divergence False Signals
To this point, look at the above chart and notice that after the divergence takes place the stock pulls back to the original breakout point. But then something happens, the stock begins to grind higher in a more methodical fashion.
If you are long the market, it doesn’t mean you should panic and sell if the high is broken with a lower RSI reading. What it means is that you should take a breath and observe how the stock behaves.
If the stock beings to demonstrate trouble at the divergence zone, look to tighten your stop or close the position.
However, if the stock blasts through a prior resistance level with a weaker RSI reading, who are you to stop the party?
#3 – Tight Ranges
Extreme Readings
In some RSI examples, you may find scenarios where the indicator bounces from below 30 to back above 70 violently.
Well, all you have to do is buy the low reading and sell the high reading and watch your account balance increase. Right? Not exactly.
There are times when the ranges are so tight you might get an extreme reading. But it might not have the volatility to bounce to the other extremity.
So, like in the above example, you may buy the low RSI reading but have to settle for a high reading in the 50s or 60s to close the position.
Conclusion
By now we hope you have a much better understanding of the relative strength index indicator. Here are a few important takeaways to remember for this tool:
RSI oscillates between 0 and 100 providing overbought and oversold signals.
Readings above 70 are considered bullish.
Readings below 30 are considered bearish.
John Hayden promotes two key levels of 33.33 and 66.66.
The default RSI formula is calculated based on:
Gains over the last 13 periods
Current gain
Average loss over the last 13 periods
Current loss
Stop loss orders are recommended when trading with the RSI.
RSI should be combined with other trading tools for better signal interpretation.
Some of the successful RSI trading strategies are:
MACD + RSI
MA Cross + RSI
RVI + RSI
Price Action + RSI
More Resources
For more information on the RSI, check out this YouTube video which provides further clarification.
On that note, if you are interested in a master class on the relative strength index, feel free to visit our friends over at Mudrex.
To practice all of the trading strategies detailed in this article, please visit our homepage at tradingsim.com.
It’s really easy to see the perfect RSI setups, but the real success begins once you practice how to handle the situations which you don’t expect. As with any strategy, we recommend a minimum of 20 trades before employing real money.
5 Trading Strategies Using the Relative Vigor Index
In this article, we will cover the relative vigor index. The index is not one of the more popular indicators, but that does not mean it lacks accuracy. We will cover five strategies you can test to...
Relative Volatility Index (RVI) – 2 Simple Trading Strategies
Have you ever heard of the RVI technical indicator? I am not talking about the relative vigor index, termed RVI or RVGI. I am referencing the relative volatility index! In this article, I am going to...
Displaced Moving Average (DMA) – Top 3 Trading Strategies
What is a Displaced Moving Average? The displaced moving average is a regular simple moving average, displaced by a certain amount of periods. This “shift” will move the average to either the right...


 Day Trading Indicators


