Today we are going to discuss two important tools for identifying support and resistance on any chart – introducing price channels and bollinger bands! During the course of this article, we will cover the details of each approach and provide a recommendation of which best suits your trading style.
What are price channels?
Price channels are one of the most important tools for active trading. Price channels are established as a stock begins to bounce back and forth between support and resistance levels. Thus, traders use price channels to set entry and exit points when trading.
Types of Price Channels
Bullish Channel
The price channel is bullish when the support and resistance levels are parallel and sloping to the upside.
Bearish Channel
The price channel is bearish when the support and resistance levels are parallel and sloping downwards.
Horizontal Channel
This price channel consists of parallel support and resistance levels. This formation develops during consolidation periods and is the most common price channel. Due to the lack of volatility, most day traders prefer either the bullish or the bearish channel.
Have a look at the below image which illustrates the three types of price channels:
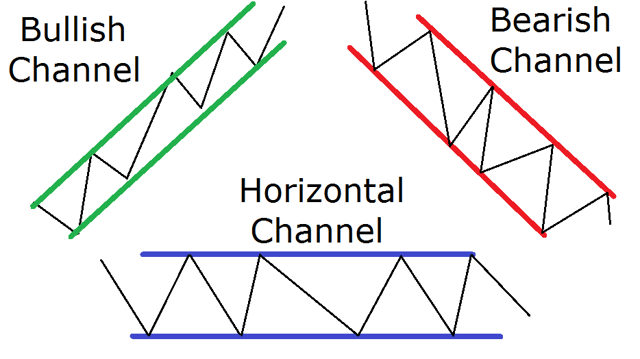
Three Types of Price Channels
Note: In order to confirm the presence of a channel, we need at least two tops and two bottoms to generate the resistance and support levels. Again, these levels should be parallel to one another. Have a look at the image below for further clarification:
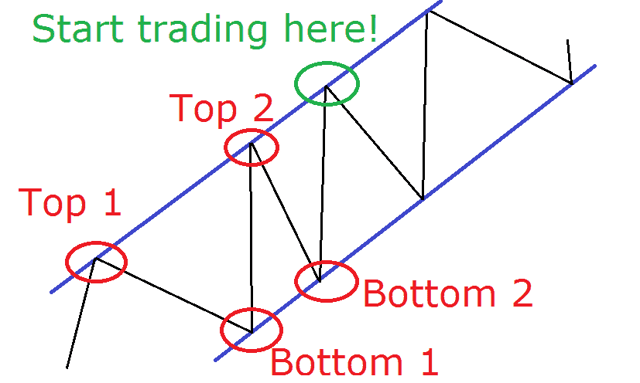
Bullish Price Channel Example
The two tops and two bottoms help form the two parallel lines of the channel. In the above image, the top highlighted in green is the first point you could open a trade. Please note, we will cover below why this first trading opportunity should only be used by the more seasoned traders.
How to trade price channels?
Trading Bullish Channels
Once you spot a bullish price channel, go long once the price bounces from the support level, which is the bottom line. You then hold your position until the stock touches the upper level of the channel, also known as resistance.
Note: You could short the touch of the resistance level, but this should be reserved for seasoned traders. Reason being, as you are in a bullish pattern, it is much harder to go counter to the primary trend.
Trading Bearish Channels
Once you identify a bearish channel, go short once the price touches the upper level of the channel. You then hold this position until price touches the lower channel, also known as the support line.
Note: Again, counter trend trading should be left to the professionals.
Trading Horizontal Channels
Earlier we mentioned that you would likely want to avoid horizontal channels for active trading. Again, this is because the market is lacking volatility and volume, which often generates false trading signals. This churn of trading activity often leads to less profitability, over trading and higher commissions.
With the disclaimer out of the way, there are still those of you that will gravitate towards trading horizontal channels.
In many cases, the price movement within the horizontal channel is limited; however, there are times volatility can live within its boundaries. When these opportunities present themselves, you will want to go long at the lower channel and short at the upper channel.
Note: One of the benefits of trading horizontal channels is you can play both sides of the market – long and short. This is because the market is in a consolidation pattern.
Let’s now walk through a real-life example of a bearish channel example.
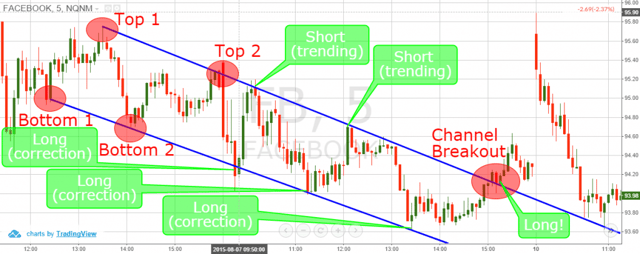
Bearish Price Channel Example
Above is a 5-minute chart of Facebook from the period Aug 6-10, 2015.
The first four red circles show the tops and bottoms required to establish the bearish channel. After establishing the channel, there were two short opportunities, which played out nicely.
The third shorting opportunity failed and Facebook began to breakout above the resistance line. After breaking out, Facebook provided a slight back test of the resistance line and did not retreat into the bearish channel.
This folks is a sign that your previous resistance line is now support and a bear raid could be in progress. This is a clear long signal, which resulted in a price spike the next day.
What are Bollinger Bands?
Bollinger bands (BB) is an on-chart trading instrument. It consists of an upper and lower band, which measure volatility and a 20-period simple moving average. The two bands are standard deviations of the price action. Thus, the bands expand and contract on the chart.
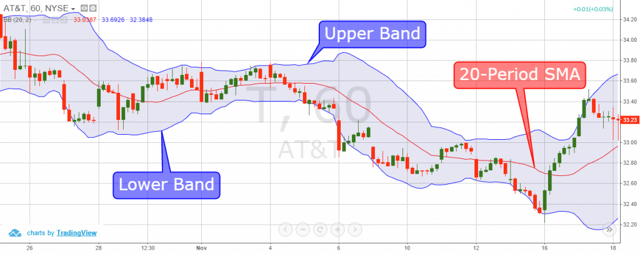
Bollinger Bands
Although it looks slightly chaotic, the purpose of the bollinger bands formula is straightforward. Traders use BB as support and resistance, to set entry and exit points on the chart and to identify an equity’s volatility.
How to trade using Bollinger Bands?
Although it may look a bit messy, using bollinger bands to improve your trading is not as hard as it may seem. The two basic bollinger band trading strategies that work are associated with price interacting with upper and lower bands.
Bounces
The main bollinger bands trading rule is when price reaches the upper or lower bands, price is likely to return to the middle line. Conversely, price will also bounce off the moving average back in the direction of the primary trend.
Riding the Bands
In this case, when price interacts with the upper and lower bands, the bands can expand at times from one another. This expansion can often signal the start of a new impulsive move.
This is also known as riding the bands, where the price literally hugs the upper or lower bands. If this happens, we go long or short once the candlestick closes beyond the bands and hold our position until the price breaks the middle line (20-period moving average).
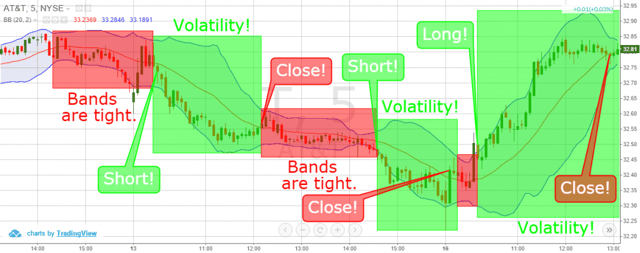
Riding the Bands
Above is a 5-minute chart of AT&T from the period Nov 12-16, 2015.
Here we spot three trading opportunities. The red rectangles illustrate the moments when the BB levels are close to each other, meaning there is low volatility. The green rectangles indicate the periods when the bands are expanding and volatility is in the air! Again, which is great for active traders.
For the first two trading opportunities, we notice the bands expanding, as the price closes below the lower band. We then hold these short positions until the price breaks the 20-period MA in a bullish direction.
The third case mirror the first two trading examples, but in the opposite direction. When the bands begin to widen, the price closes outside of the upper band. Thus, we go long and hold until the 20-period MA is broken in a bearish direction.
These three trading positions brought us a profit of $0.53 (53 cents) per share!
Price channels or Bollinger Bands?
The truth is that both of these tools are very effective and could lead to consistent profits, if executed properly. Yet, BB and channels are quite different.
Number of Trading Opportunities
Channels are simply based on price and do not account for any fancy calculations. Therefore, parallel channels may or may not develop on the chart. However, bollinger bands are dynamic and are always present on the chart – every interaction with a band could be traded. Since BB is a dynamic indicator, it is the riskier option. Some traders say, “Nothing good will happen to you if you are always in the market!” If you are not prepared for dynamic trading, you are likely to fail when trading with BB. Thus, price channels might suit you better here.
Early Entry and False Signals
BB also gives us the option for an early entry, while price channels require at least two tops and two bottoms in order to confirm the channel. In addition, BB assists you with a moving average, which helps a lot especially when determining exit points. Yet, a moving average could instantly be added to a price channel if needed.
Remember, we said that corrections could be traded with channels (mainly horizontal)? Meanwhile, BB is very confusing if used to identify corrections. On the other hand, BB has clear rules when to enter and exit the market. With price channel trading, you might be tricked sometimes. There are cases when the price breaks a level of the channel, creating the impression that this is the beginning a move. You open your position, but then the price suddenly jumps back into the channel! What a shame!
Have I completely confused you yet?
Let’s try to clean things up a bit. If you are a dynamic trader, then BB might suit you well. If you are not that comfortable with price dynamics and you may want to slow things down a bit, then price channels are for you.
In both cases, if you follow the rules as discussed above, you will already be well ahead the majority of traders!
In Conclusion:
- There are three types of price channels:
- Bullish Price Channels (trending)
- Bearish Price Channels (trending)
- Horizontal Price Channels (consolidations)
- We confirm the presence of a channel by spotting at least two tops and two bottoms – parallel to each other.
- The trending moves in channels are more profitable and less risky. Trade corrective moves only if you are experienced!
- Bollinger bands are an on-chart indicator, which measures volatility.
- BB components are:
- Upper Band
- Lower Band
- 20-period MA
- When the bands expand, the stock is volatile and could start trending! This is when we should enter the market.
- We exit the market when the price breaks the 20-period MA.
- When the bands are tight, stay out of the market.
- BB puts us in the market relatively earlier than price channels.
- Corrections can be traded with price channels, while this is very confusing with BB.
- BB is riskier than price channels, because there are way more trade signals.
- Price channels will suit you better if you are a quiet trader. BB trading is for active traders!

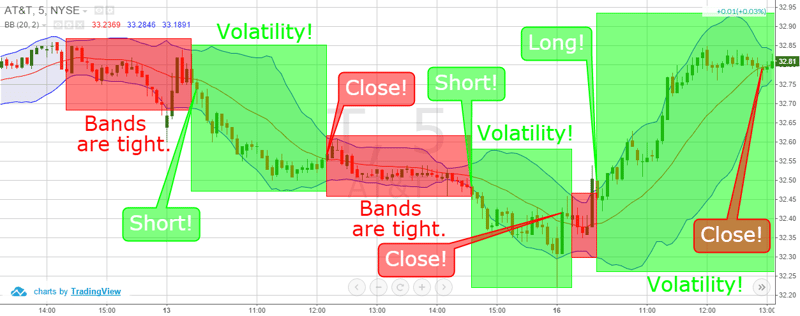


 Chart Patterns


