✓ Reviewed by Kunal Vakil, Co-Founder of TradingSim · Updated Mar 31, 2026
The month of January in the stock market has strong significance in predicting the trend of the stock market for the rest of the calendar year. This phenomena occurs between the last trading day in December of the previous year and the fifth trading day of the new year in January. The January Effect is a result of tax-loss selling which causes investors to sell their losing positions at the end of December. The January Effect is predicated on the idea that these stocks, which have been sold off to realize the tax losses, will be at a discount to their market value. Bargain hunters step in and load up on these laggards and this creates buying pressure in the market.
Statistics from the first five Trading days in January
When the S&P500 has a net positive gain in the first five trading days of the year, there is about an 86% chance that the stock market will rise for the year, it has worked in 31 out of the last 36 years (as of 2006). The five exceptions to this rule were in 1966, 1973, 1990, 1994, and 2002. Four out of these five years were war related, while 1994 was a flat market. As history suggests, the markets average nearly 14% gains when the January Effect is triggered.
On the flip side of the coin, when the first five days of January are lower, there is no statistical bias of the market, up or down. It is anyone’s game at that point. Not a very reliable indication.
Statistical response to an UP or DOWN January
A down January is a bad omen for the stock market. Yale Hirsch of the The Stock Traders Almanac suggests that since 1950, every down January in the S&P500 preceded a new or extended bear market, or in some cases, a flat market. They go on to further suggest that down January’s are followed by substantial declines averaging -13%.
January Effect or December effect?
The publicity of the January Effect has watered down the potential net gains from it over the past few years. In fact, history suggests that small cap stocks far outperform large caps during the middle of December. To avoid the sharp mark up in shares in the beginning of January, institutional traders have started accumulating many beaten down small cap stocks in December to get a head start on the January Effect. This shift has been seen in the markets and December has also become a very strong year for the stock markets, also known as the December Effect.
Small Cap Trading Example of the January Effect
There are still debates between finance experts if the January effect anomaly can be properly traded. Traders constantly ask themselves “Is there a January effect?” This is something you need to decide for yourself.
Since some investors do not find a logical explanation behind the January effect, they prefer not to put an emphasis on the January price move when making future decisions.
If the statistics show that in 31 out of 36 cases the yearly trend matches the January price behavior, do you really want to play against the odds? We are traders and we believe in trends. 31 out of 36 means that the reliability of the January effect is pretty darn accurate. Thus, instead of continuing the debate over its accuracy, I am going to share with you a few trading strategies, which will help you trade a yearly price move based on the January effect forecast.
But let’s first give you a real January effect trading example:
January Effect Trading Example
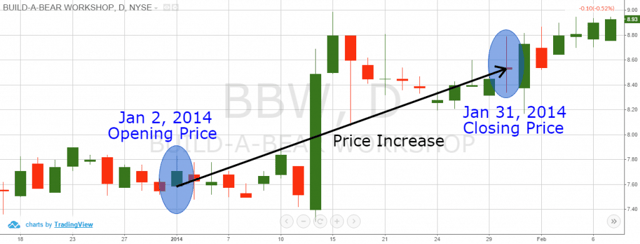
This is the daily chart of a small cap company names Build-a-Bear. The image shows the stock price move of the company between Jan 2 – 31, 2014. As you see, the price of BBW opens at 7.58 on Jan 2nd and closes at 8.53 on Jan 31st, which is an increase of 12.53%. Thus, the January effect efficient market hypothesis suggests that the overall trend by the BBW will be bullish. If you believe in the January anomaly, you will definitely try to trade the Build-a-Bear stock over the year. But let’s now see what really happened by year end.
January Effect Yearly Trend
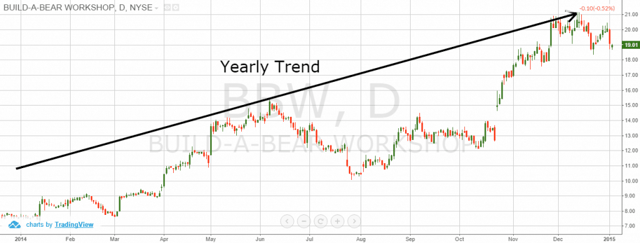
Well, isn’t that impressive? On the zoomed out daily chart of Build-a-Bear we see an impulsive stock move. After reaching $8.53 per share on Jan 31st, the price went all the way up to $21.00 per share by the end of December.
Since the January effect provides a one-year forecast, trades based on the January effect should be implemented on bigger charts – daily or weekly.
January Effect Trading Strategies
Since the January effect suggests the market direction, you need to decide something when trading this anomaly. Are you going to hold the stock during the whole year? Or you are going to time the corrections throughout the year. If you choose the second option, then keep reading!
We will compare buy and hold versus the time strategies on the Build-a-Bear chart from 2014.
Trading the January Effect with Price Action
Although some traders feel that price action trading is too simple, when it comes to the January effect, it gives all we need – support and resistance levels. Thus, this strategy is the simplest for trading the January anomaly. When the price is trending, it creates tops and bottoms.
On the daily chart, every bottom should be perceived as a support and every top as a resistance. If the price breaks a support, you should exit your trade. If the price breaks the resistance, you hop back in the market.
In the image below, you will see how the price action trading strategy works on the January effect of the 2014 Build-a-Bear bullish move:
January Effect + Price Action Trading
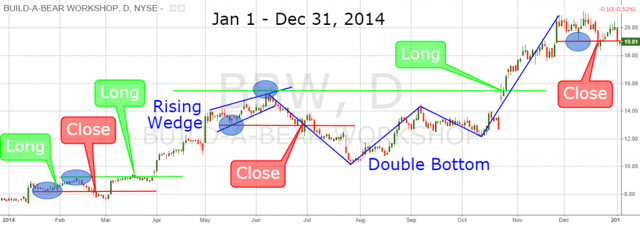
Every broken resistance is an entry point and every broken support is an exit point. Thus, I have marked the important supports with red and the important resistances with green on the chart. The blue circles indicate the highs and lows, which create these levels.
First we go long in the beginning of February when we have identified the bullish January move. The price creates a top, but it breaks the support placed on its previous bottom. Thus, we close the trade and we mark the top as resistance. From this trade, we lost $0.77 per share. I know this is a bad start, but if you wait for the next two trades, your patience will be rewarded.
As you see, the further price increase breaks the resistance we placed and we go long for a new price increase. This is exactly what happens. We stay in the trade from the middle of March, 2014 until the end of July. We exit when BBW’s price confirms a rising wedge formation and breaks the support which marks the beginning of the figure. We close our trade on profit of $3.12 per share. We mark the top of the rising wedge as a resistance level, which we will use to enter the market in case of a new price increase.
Then we stay out of the market for almost 4 months since the correction of the trend is pretty deep. The BBW price needs time in order to break the resistance placed on the top of the wedge. At the same time, the price forms a double bottom chart pattern, which reminds us that soon it might be time to go long. Although the formation is confirmed, we stay out of the market until the price breaks the resistance on the wedge’s highest point.
The price breaks the resistance at the end of October, 2014 and we buy BBW again. The price starts a new increase and we are back in business! We hold the stock for almost two months until the price breaks one of its previous bottoms at the end of December, 2014. The last trade of the January effect generated a profit of $3.50 per share.
Using a price action trading strategy on the 2014 Jan effect of Build-a-Bear, we generated a total profit of $5.85 for a bit more than 6 months of holding the stock. Although this might not look very impressive to you, remember that the initial BBW price in January was $7.58 per share.
Trading the January Effect with 50, 100, 200 SMA
Again, the best indicators to trade the Jan effect are the on-chart tools like the MAs. For this strategy I use three SMAs: 50-period, 100-period and 200-period.
The 50-period SMA is the signal line. When the 50 SMA breaks the 100 SMA in a bullish direction, we go long. When it breaks it in bearish direction, we close the position. The 200-period SMA is used to signal a reversal on a much larger scale. In other words, if the month of January says that the yearly price effect will be bullish, a break of the price through the 200 SMA will defeat this theory. Let me now show you how the three SMAs can help you trade the January effect:
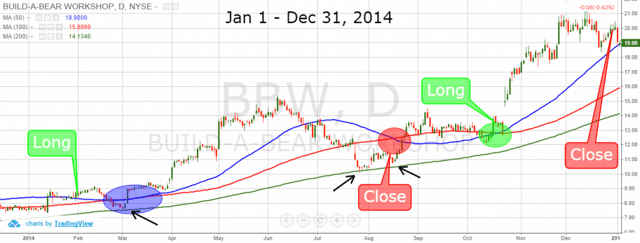
This is the same daily chart of BBW showing the overall price increase in 2014 after the bullish month of January. The blue line on the chart is the 50 SMA, the red line is the 100 SMA and the green line is the 200 SMA.
We go long in the beginning of February after the month of January told us that the year is likely to be bullish. Notice the blue circle which comes right after our entry point on the chart. This is the moment, where we closed our position in the January effect price action trading strategy due to a break in support. This time, though, the 100 SMA sustains the pressure of the 50 SMA and we see no break of the blue SMA through the red one. Thus, we stay in the market and we keep our position.
Yet, when the deep correction comes in late summer, we are forced to close our position relatively lower than with the price action trading strategy. This is because the 50-period SMA needs more time in order to move according to the price decrease and to perform a bearish crossover with the 100 SMA. This happens in the red circle. After staying in the market for six-and-a-half months we close earning a profit of $2.97 per share.
Two months later, the 50 SMA gets back above the 100 SMA and we go long again following the trend of the January effect. We hold the BBW equity for more than 2 months until the end of December. Our second long position brought us a profit of $7.10 per share. That’s what I am talking about.
Did you notice the black arrows I placed on the chart? These three arrows show the moments when the BBW price tests the 200-period SMA as support. If the 200 SMA is broken in a bearish direction, I advise you to abandon your hopes from the January effect. Fortunately, in our case the January effect is valid and we stay in the market. This is so because the 200 SMA successfully supported the BBW price three times.
During this trading strategy we opened two positions for almost 9 months in total. The two long positions brought us a total profit of $10.70 per share.
Trading the January Effect with the Alligator
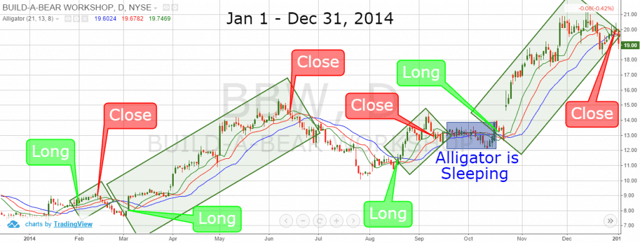
The Bill Williams Alligator is another on-chart trading tool, which is suitable for trading the January effect anomaly. In this strategy, we will enter the market when the Alligator wakes up and starts eating. We will exit the market when the Alligator starts falling asleep. This indicates consolidation or correction. Have a look at the image below in order to see how this January effect strategy works:
January Effect + Alligator Indicator
Let’s now compare how the Alligator performs in comparison to the other two strategies.
We go long in the beginning of February. Half a month later the Alligator gives a bearish signal and we exit the market relatively soon with a profit of $0.46 per share.
Then we stay out of the market for another two weeks until the alligator starts waking up. When the lines are distant enough, we go long. Notice that in this trade the Alligator provided the earliest possible entry and also the earliest exit. We caught the whole bullish move before we exited due to an Alligator falling asleep. We stayed in the trade for three-and-a-half months creating a profit of $6.40 per share.
Then the deep correction begins and we wait for another bullish signal from the Alligator.
Then the alligator completely falls asleep for a month. In the middle of October the lines began to separate again and we go long as the Alligator is awakening. We hold the trade for two-and-a-half-months until the end of the year. This position brought us a profit of $6.88 per share.
With this trading strategy we stayed in the market for seven-and-a-half months generating a total profit of $15.50 per share.
The Best January Effect Trading System
My opinion here is that the Alligator trading system outperforms the other two strategies. Since the Alligator is a bit more sensitive on price moves it provided an extra fourth position. This trade happens in the middle of the year of 2014. Also, on the daily chart of BBW, the Alligator’s signals are very accurate. The Alligator managed to cope with the deep correction in the best possible way. On the other hand, the SMA strategy held us with our position until the end of the correction – which hurts! The Alligator gives a bit earlier entry signal, putting us in the market right at the beginning of the trending move.
Conclusion
The January effect provides an early indication that the trend will continue for the remainder of the year.
The January effect is more common with small cap stocks (less than $300 Billion).
Statistics shows that the January effect accurately predicted market direction in 31 out of 36 cases.
The best way to trade the January effect is to use daily or weekly charts.
Some of the successful January effect trading strategies are:
Price Action Trading
50, 100, 200 SMA crossovers
Bill Williams Alligator’s signals (sleeping, awakening, eating)
The most effective strategy to trade the January anomaly is hunting for signals with the Alligator.
Alton Hill is the Co-Founder of TradingSim with over 18 years of trading experience. He completed the Design Thinking Bootcamp at Stanford’s D.School and brings expertise in Product Development to create the best trading simulation experience. His strategy focuses on trend-following systems, targeting high-volatility stocks with strong primary trends using the 15-minute chart.
Do you notice how a stock or a group of stocks behave when it touches all-time highs? Have you been curious on how stocks perform as they approach this key milestone? All-time highs in stocks are a...
Day Trading High Momentum Stocks | Tradingsim Video Lessons
The broad stock market made a ferocious recovery off of the BREXIT lows. It was a broad-based market rally that essentially retraced everything that was lost. As a day trader, I look for high...
Apple Inc, trading on the NASDAQ exchange is one of the most popular stocks preferred by both intraday traders and long term investors. Investors flock to APPL stock for a number of reasons ranging...


 Trading 101


