In now my fourteenth year of trading, if I had to boil down one of the key turning points in my ability to consistently make profits it would be when I understood how to identify trending stocks. This concept earlier on in my career would baffle me because I could not find a clear answer anywhere on the web or in books.
My search for how to identify a trending stock led me down the path of researching Elliott Wave analysis. Elliott Wave had strict rules based on math that determined when a stock was becoming impulsive, but these waves or counts would constantly change as the stock moved.
Eventually, I gave up on the idea of becoming an Elliott Wave expert, not that it doesn’t work, but because it didn’t work for me. When using Elliott Wave I found myself trying to anticipate or predict the markets next move which made analyzing and profiting from the market far too complicated.
In this article, I am going to save you countless time and money by providing you a clear-cut strategy for how to identify when a stock is starting to trend. Knowing when a stock is starting to trend is how professional traders take the lion share of a stock’s swing move.
While my strategy is specific to swing trading stocks, you can apply the same principles to your trading methodology to increase your gains.
First You Need a Trade Trigger
How do you know when a stock has just started trending? Do you use a special indicator or trendlines? Do you apply the same method to all timeframes?
These are the types of questions I would ask myself as I was trying to determine when the party had officially started.
The first thing you need in determining the start of a sharp move is a trade trigger. When I say trade trigger, this is basically a way for you to know that the move has officially begun.
Why is finding a trade trigger important?
The majority of the time, there is absolutely nothing going on in the market. It’s all just noise. Stocks go up, they go down, they are flat – who can make sense of it all? The end game for the smart money is to get you caught up in all of the nonsense, so you are not able to hold on just long enough to book the real profits.
How to identify when a trend has started
To identify when a stock is trending, I use the following components:
- P&F chart
- 30-minute time scale
- Trendline
- 1-box reversal
- Scaling method of Percentage
- Box Size of 1 percent
Once you make all of these configuration changes, you will produce a chart with an output that looks something like this:
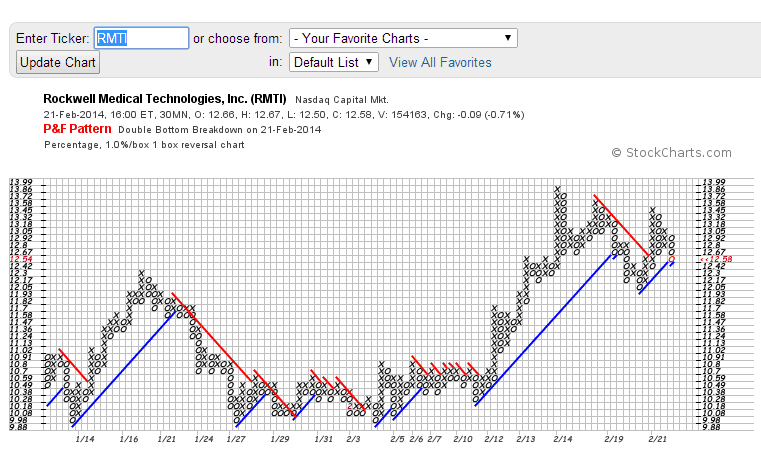
Are you able to see anything in the chart that gives you a clue that the stock just started an uptrend? You are probably focusing on the sharp price move, but who wants to jump on a trade that late in the game?
Look closer, back to when the trend began. Do you see it now?
Those blue lines represent the price trend based on a 45-degree angle from a low. As the stock price backs into this line if penetrated a new line starts. Notice how the blue line in mid-February had no breaks and carried the stock much higher.
Now how do we know that an impulsive move has just started? After looking at literally thousands of price charts, I have concluded that my trade trigger begins once a stock moves in one direction for 8 P&F boxes without violating the trendline.
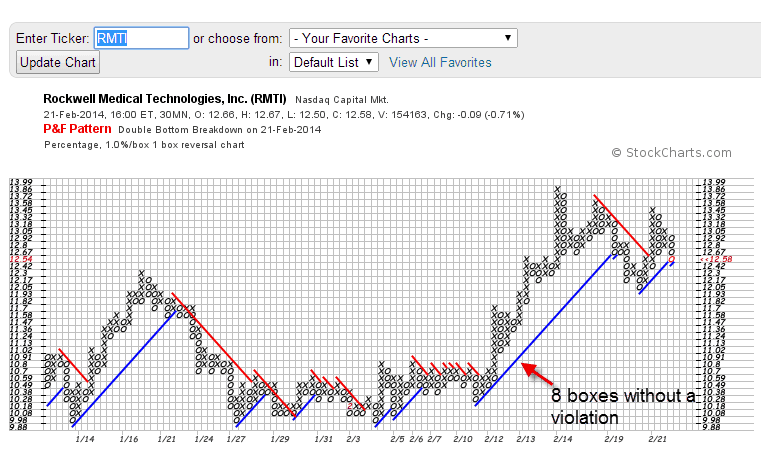
A move of 8 boxes signifies that the bulls or bears are committed to moving the stock in one direction regardless of the back-and-forth gyrations. This controlling interest is also strong enough to maintain the movement above a trendline.
Once the stock goes in one direction for 8 boxes, your trade is now active. Until that point, everything and I mean everything is just noise.
Let me repeat this statement before we move further in this article. All of the price moves, head fakes, candlestick formations, are just noise. Until the smart money shows their hand in terms of how far they can push the stock, it’s all just games.
For you non-P&F practitioners out there, you will need to identify when you believe the bulls or bears are ready to begin an impulsive move. Without this level of certainty, you will constantly be in doubt of when the money train has just left the station.
When do you enter the trade?
When you enter the trade will largely depend on your risk profile. For me, I like to buy before the trade trigger is initiated. This means that if I want to buy a stock long, I will buy the pullback in midst of all the fear. This allows me to (1) get the stock at a discount and (2) lower my risk if the trade trigger fails.
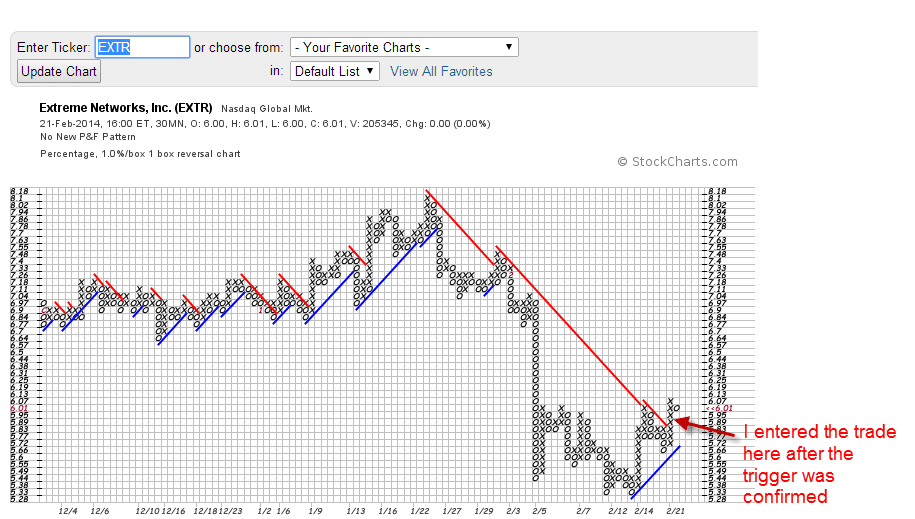
The other option, which I just did yesterday, is to buy the stock after the trigger has been confirmed. While this increases your risk, you have now confirmed that the uptrend has started.
If you buy the dip, the trend does not activate until the stock moves 8-P&F boxes. Until that point, you just sit tight.
If you take the more conservative route and buy after the trend is confirmed, you will want to use the exit strategy to manage the trade, which we will cover in the next section.
When to exit an Impulsive Stock
Now that you know the stock is impulsive, the next thing you need to figure out is when to exit the trade. Stocks that are trending hard have a shelf-life. Depending on the timeframe you are trading, this shelf-life could be minutes, days or months.
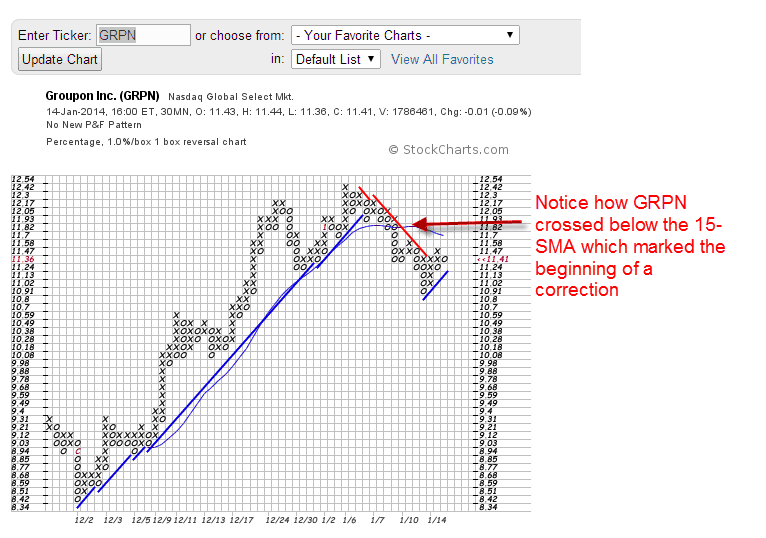
For my swing trading system, I again use P&F charts to manage the trade. I place a 15-period simple moving average on a 30-minute chart to trail the price action. The thing I like most about placing a simple moving average on a P&F chart is that it only moves when the price moves. This is completely different from a standard price chart where the moving average has to print due to the time factor. If you think about it, just because a certain amount of time has elapsed, this really has no bearing on whether the stock is still trending or not.
Notice how the simple moving average is able to provide you a clear direction of when to exit the trade.
No matter what you use to exit the trade, the point I am trying to convey to you is that it should be simple. The simpler you keep things the greater the chances of success you will have in the long run.
How Much Can You Expect to Make?
This article would not be complete without addressing the crystal ball question of how much can you make on a trade. If you are asking yourself this question, you are still very young in your trading journey.
Please repeat after me, “The market gives what it wants. I have no control over how high or low a stock can move. Past successes and failures are just that, past successes and failures.”
The best you can do when attempting to gauge how far a stock can run after an impulsive trend begins is to look at the volatility of the stock. You can do this quite easily by using an indicator such as the average true range.
For my swing trading system, I like to find stocks on a weekly basis that have an ATR range between 10% and 20% of the stock price. For example, if a stock has a weekly closing price of $20, I like the ATR to have a value between 2 and 3.
This ratio of the average true range to the stock price is my sweet spot for risk/reward. It allows for just enough volatility that I can capture large swing moves of 20% – 40%, without exposing myself to extreme risk when I buy a stock on a pullback.
If you trade stocks that are more super volatile like biotechs or slow clunkers like IBM, you will need to adjust the number of boxes to gauge the beginning of an impulsive trend and you will also need to adjust the length of the simple moving average for your exit strategy.
The tweaking of these two inputs will take some trial and error in order to get it just right for your trading style, chosen timeframe and risk profile.
How to know when you are wrong
Believe it or not, knowing when you are wrong is the most important part of any trading strategy and is often the hardest thing to grasp.
For some traders they will try the ‘cut your losses short strategy”, only to give their account the death by a thousand cuts.
So, how do you know when you are wrong? Well with my swing trading system, after the trend trigger is active if the stock crosses the simple moving average by 2 boxes or more, I know it’s time to exit the trade.
The other way I know I have misjudged a trade is if the stock develops another impulsive move in my desired direction. For example, if I’m long the stock should pause, build cause and then rally higher triggering an 8-box trade trigger. If the stock, however, builds a base only to move lower again to form another 8-box trade trigger, I know I am dead wrong. When this occurs, I will use the next impulsive up move to exit the trade.
In Conclusion
You have to determine what it means for you to define a trend, ride it effectively and then exit with a profit. There are a number of methods, and studies on the matter, but you have to find the right mix of ingredients that work for your trading style. If you utilize the methods discussed in this article, you will start to see the market through a new lens.
Images Courtesy of Stockcharts.com

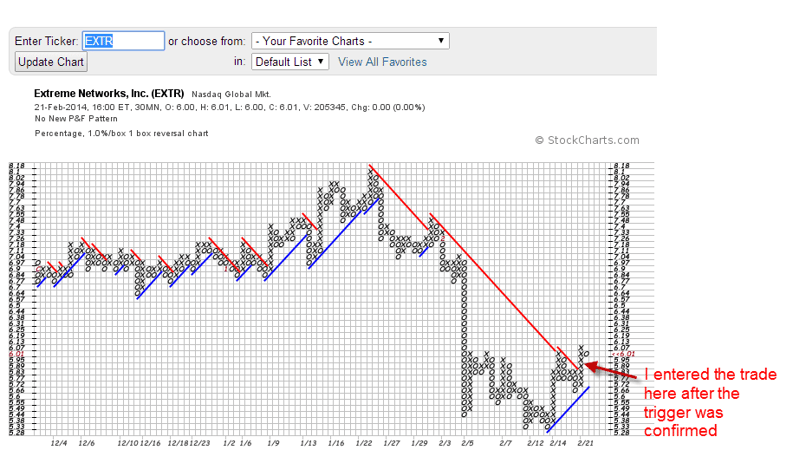


 Chart Patterns


