Ease of Movement Indicator (EMV) – The Best Way to Interpret Price Action
Nov 11, 2015
Written by: Al Hill
The Ease of Movement (EMV) is an oscillator, which analyzes the relationship between price and trading volume. The EMV indicator has an uncanny ability to identify price inefficiencies in the absence of market volume.
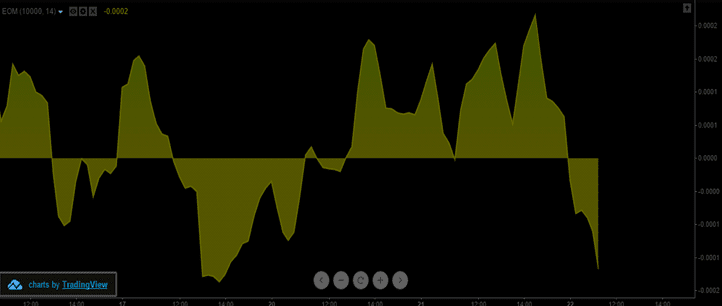
The EMV indicator is often represented as a curved line, which bounces above and below zero. Whenever the EMV is above zero, it conveys the price is increasing with relative ease. Conversely, when the EMV is below zero, the security is decreasing unchecked; hence, the indicator is named Ease of Movement. The below image displays the ease of movement indicator in action:
EMV Indicator
It appears chaotic, don’t you think?
Nevertheless, after reading this article, you will garner a clear understanding of how the indicator can assist in your trading endeavors.
How to Trade with the Ease of Movement Indicator?
Opening a Position
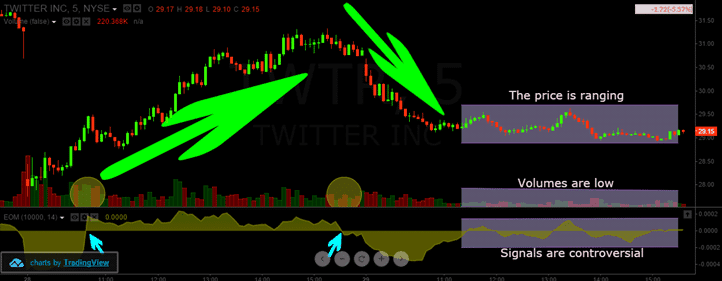
The truth is the Ease of Movement indicator is not a standalone trading tool. One of the most common indicators to combine with the EMV is volume. Since the EMV indicator is derived from volume activity, volume is a valuable tool in validating trading signals. The below image illustrates how you can confirm a setup prior to trade entry:
EMV Trading Signal
This is a 5-minute chart of Twitter from October 28 and 29, 2015. First, we see a gap down, which results in tremendous down pressure on the EMV below the zero line. This bearish action acts as a sign of caution for traders looking to enter long positions.
Despite this negative price action, approximately 15 periods later, the EMV crosses above the zero line.
Did you notice that as the price is breaking out, volumes are also increasing? This bullish price action coupled with strong trading volume provides a great opportunity to establish a long position. If entered a long position in Twitter, we would have enjoyed the spoils of a nice impulsive move higher.
At the end of the bullish move, the EMV begins making lower highs with each subsequent rally and begins to draw closer to the zero line. In addition, volumes continue to drop with each trading period.
Fortunately, for us, once there is a bearish cross of the EMV indicator below zero with increased volume, we use this as an opportunity to exit our long position and get short.
We open our short position and are able to ride the wave back down for another round of healthy gains.
When to Close a Position
Indeed! We know when to enter a trade, but does the EMV indicator provide accurate exit signals?
The answer is yes and no.
As previously mentioned, the EMV is not a standalone trading indicator. At the same time, the volumes indicator is only good for confirming signals, but not for telling us when to enter or exit.
What are we to do?
Here we have two options: the first one is to stay with the EMV and volume in order to keep things simple.
Another option is to combine an additional trading indicator for increased accuracy.
Option 1 – Keep it Simple
In every decision making process we should always consider the option to do nothing. This approach would simply call for us to exit positions whenever the EMV indicator breaks the zero line contrary to the primary trend.
Option 2 – Add a Moving Average
The use of moving averages is a classic method for exiting trades
The moment price closes on the opposite side of the Moving Average, the position should be closed. It is very important to note that your risk appetite will dictate the number of periods you use when configuring your moving average (i.e., 5, 10, and 20).
The other positive of using a MA is that it gives us a bonus validation entering and exiting trades. Whenever EMV signals are supported by increased market volume, coupled with a moving average signal, you have what I like to call the triple threat.
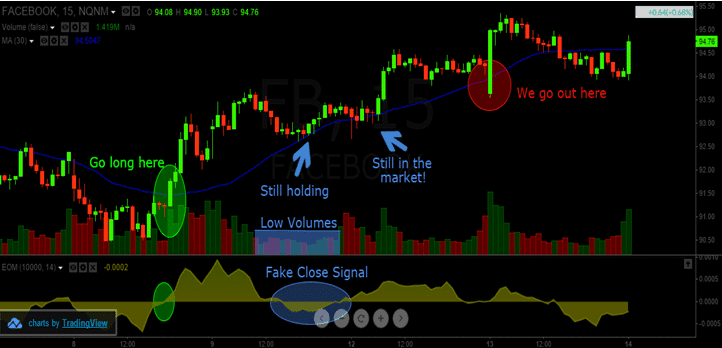
See the below image for a trading example of option 2:
EMV with SMA
Above is a 15-minute chart of Facebook from October 8-14, 2015. The green circle represents when we enter the market and the red circle displays our exits.
The first trade signal occurs after the confirmation of a double bottom, price closing above the SMA, increased volume and the EMV moving above 0. This provides four confirmation points and displays what we like to call market harmony.
We go long on this signal and enjoy a healthy run up over a number of trading periods. With the opening of the markets on October 13, 2015 Facebook has a significant gap down below the SMA. Therefore, we stick to our strategy exit our long position.
Let’s go through another example on the short side.
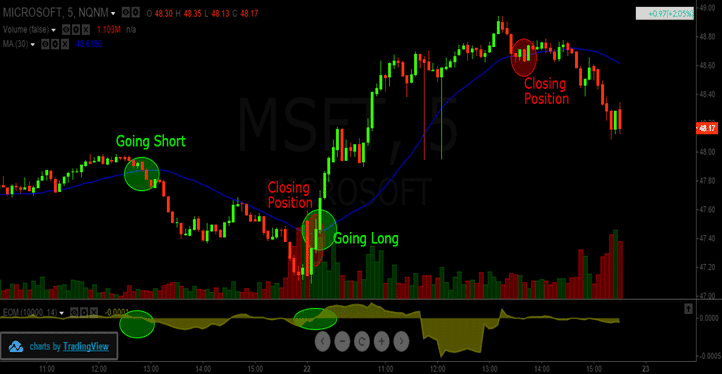
EMV Short Trade
This time we have 5-minute chart of Microsoft from October 21 and 22, 2015.
Our first position is short and is based on a drop of the EMV below zero and a close below the SMA.
Note that the volumes at this time are relatively low. Nevertheless, we decide to go short, because we get a bearish confirmation from the price closing below the 30-SMA.
The price action begins a sharp bearish decline with a minor test of the 30-SMA prior to resuming the downtrend in earnest.
It’s not until the market shoots sharply higher with volume do we exit our position and go long.
In both of these examples, the Ease of Movement indicator formula, combined with volumes and a Simple Moving Average can provide a trader more clarity into the health of the price trend.
In Conclusion
The Ease of Movement Indicator is a volume oscillator that incorporates price action.
A trader can enter a long position when the EMV closes above the zero line and can go short when the EMV closes below the zero line.
Volume and SMAs are the best friends to the Ease of Movement indicator.
5 Key Differences between the Stochastic RSI and Stochastic
What is the Stochastics Oscillator? While there are many oscillators, the Stochastics and Stochastic RSI are two of the most popular technical indicators. So, why do we need two indicators with...
Price Oscillator Definition The price oscillator indicator displays the difference of two moving averages in either points or in percentages. This technical indicator is very similar to the MACD, but...
Price Rate of Change Indicator The price rate of change indicator (PROC) or simply, rate of change indicator (ROC) is a price-based technical oscillator that is displayed in the sub-window. The PROC...


 Momentum Indicators


