The displaced moving average is a regular simple moving average, displaced by a certain amount of periods. This “shift” will move the average to either the right or left of the price.
How to use the Displaced Moving Average?
Displacing a moving average is a practice used by traders to more accurately match the moving average with the price action.
Furthermore, we all have experienced situations, where the price walks the trend line (as a support or resistance), but there are times where price will close slightly beyond the average. Because after breaching the average, how many times have you observed price return in the direction of the primary trend?
Hence, this is where the displaced average comes into play. You would need to look back a certain number of periods to see which displaced average does the best job of encapsulating the price action.
There is No Perfect Setting
Also, the one thing I want to say up front is there is no perfect setting. If anything, you will need to configure the displacement of the average based on the specific security.
Negative and Positive Values
It is very important to emphasize that if the moving average is displaced with a negative value, it is displaced backward or to the left.
Displacing the average to the left is considered a lagging indicator.
When you displace the average with a positive value, it is displaced forward and is considered a leading indicator.
Displaced Moving Average Chart Example
Below is an example of the difference between the three moving averages – simple, displace to the left and displace to the right.
Three Moving Averages
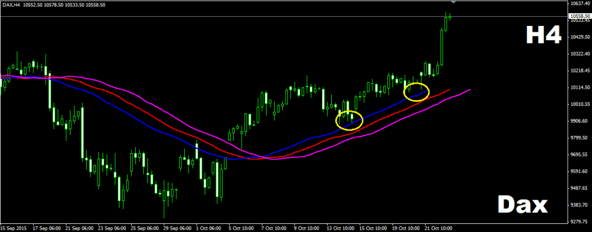
This is a screenshot of the DAX chart on an H4 time frame.
The red line is a standard 50-period simple moving average. The blue line is a 50 period -5 displaced moving average and the magenta line is a 50 period +5 displaced moving average.
In this case, the blue displaced moving average (50, -5) looks like a better fit for the DAX.
Does this mean you should apply the 50-period average with a -5 displacement to every chart? Absolutely not.
Therefore, you will need to tweak the average to best fit your chart.
How Do You Recognize which Displaced Moving Average You Need?
The answer to this question is quite simple – trial and error!
Below you see an example, where we have a 20-period Moving Average displaced by +3 periods.

As you see, there are some swing lows, which conform to the displaced moving average level and use it as support.
On the other hand, there are a few where the price closes below the displaced moving average. This means that the moving average might be better to be displaced in the opposite direction.
Therefore, let’s shift the moving average forward! We change our displaced moving average from (20, +3) to a displaced moving average (20, -3):

Voila!
As you see, the bottoms of this uptrend are much better suited with the displaced moving average (20, -3) in comparison to the prior configuration.
How Can You Adapt the Displaced Moving Average Indicator to Your Strategy?
We are going to go through three suggestions of how the DMAs could be combined with other trading indicators. This will give you some idea of how you can combine the indicator with your existing strategy.
-
Simple Moving Average (SMA), Displaced Moving Average (DMA), Momentum Indicator
Below you will find a screenshot of the EUR/NZD currency pair on an M30 chart.
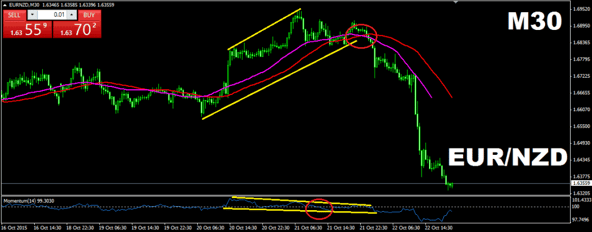
Combining a Simple Moving Average (SMA), with the same period Displaced Moving Average (DMA) + Momentum Indicator
On the chart, we are displaying two moving averages – SMA 50 (red) and DMA 50, -10 (magenta). Also below the chart, we have added a momentum indicator.
What we are hoping to accomplish is by looking at the momentum, we can identify a divergence with price and then use the moving averages to validate the trade signal.
In this example, we are reviewing a short example of the EUR/NZD.
Execution of the Strategy
Price Divergence with Momentum Indicator
There is a strong bearish divergence between the momentum indicator and the price action (marked with the two yellow lines at the bottom of the image).
Momentum Indicator Shifts to the Downside
The momentum indicator breaks the 100 level line in a bearish direction, which gives us a second bearish signal. For those of you not aware, a break of 100 on the momentum indicator is an indication the bears are in control with the indicator.
DMA Breaks the SMA to the Downside
The magenta DMA 50, -10 breaks the SMA 50 in a bearish divergence, confirming the authenticity of the upcoming bearish activity.
So the price divergence with the momentum indicator, the momentum indicator breaking 100, and the DMA breaking thru the SMA led to the bearish sentiment. These signals triggered a short sell at the yellow circle in the chart.
One point to note is the validation of all these signals when day trading is difficult. We as humans can make some mental mistakes and having to wait for all these things to line up before pulling the trigger can be difficult. Also if the action is moving quickly, it again can provide challenging to pull the trigger as the action is streaming in front of you in real-time.
Therefore, just keep this in the back of your mind regarding your ability to decipher, interpret and execute in a matter of seconds.
2. Combining a positive and a negative Displaced Moving Average (DMA) with the same period Simple Moving Average (SMA) + parabolic SAR
In this example, we are going to use moving averages and the Parabolic SAR to determine trade entries and exits.
Below you will see a screenshot of a USD/CAD H4 chart.
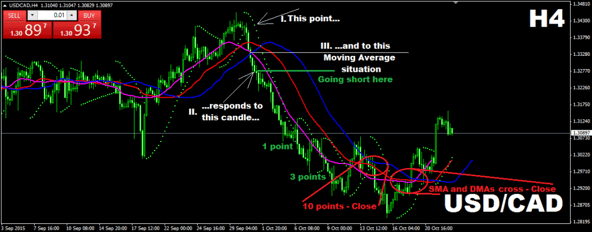
Combining a positive and a negative Displaced Moving Average (DMA) with the same period Simple Moving Average (SMA) + parabolic SAR
Because we are using three moving averages – two DMAs, 30, -10 (magenta) and 30, +10 (blue), and SMA 30. As you see, we have created a displaced moving average channel, where the SMA acts as the middle or control line.
The green dots are the parabolic SAR.
Execution of the Strategy
We will now explore when there is an opportunity to sell the security short.
Identify Trade Entry
First, we wait for the security to break the parabolic SAR to the downside. This gives us the signal that market sentiment is turning bearish.
Furthermore, we wait for the DMA (110 magenta color) to cross beneath the leading DMA (+10 blue color) and the SMA 30 (red color).
Exiting the Trade
Once in the trade, you simply hold the position until the security crosses back above the Parabolic SAR.
One point to note with this strategy is that you need a strong trend to capture the move. Above all, this is the hard part about trading. You need to realize that you may have 50% of your trades which float sideways. But, it only takes 50% of your moves to trend as strongly as the example for you to turn a profit.
3. Displaced Moving Average (DMA) and Simple Moving Average (SMA) + Stochastic Oscillator and Relative Strength Index (RSI)
Below you will see an H4 chart of the AUD/USD Forex pair.
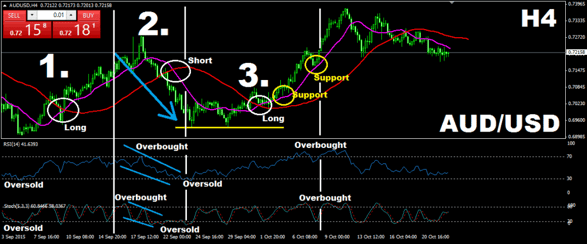
Displaced Moving Average (DMA) and Simple Moving Average (SMA) + Stochastic Oscillator and Relative Strength Index (RSI)
Execution of the Strategy
We are using the oscillators to determine trade opportunities as a result of crossovers of the moving averages. This is by far the busiest of the strategies mentioned in this article. You will need to determine if so many indicators on the chart create a sensory overload for you.
Identify Trade Entry
We wait for the RSI and Stochastic to enter an overbought or oversold area.
Next, we wait for the leading DMA to cross the simple moving average. We then open a position once all of these indicators are all aligned and provide the same signal.
Exiting the Trade
We close our position whenever the RSI goes to the other extreme or whenever the moving averages cross one another.
Let’s now go through the particular cases demonstrated in the image above:
Trade #1: We get an oversold signal from both the RSI and the Stochastic Oscillator. We then see a positive cross in the averages and go long. We follow the trend with our DMA until the RSI crosses the overbought area.
Hence, this is where we exit the position.
Trade #2: The RSI and stochastic oscillator give overbought signals.
The DMA and SMA cross and we go short.
As a result, we close our short position the moment the RSI enters the oversold territory.
Trade #3: The RSI and stochastic oscillator are in the oversold area. We wait for the DMA to cross the SMA to the upside and we go long.
We are stopped out of the market because the RSI gets into the overbought area pretty fast. The trade still brings a decent profit of 160 bullish pips.
In Summary
- The displaced moving average is a great way to adjust a regular simple moving average to fit a trend line.
- It has the same function as a regular simple moving average – to determine support and resistance.
- If the moving average is displaced with a negative value, it is shifted to the left, and it is lagging. If the moving average is displaced with a positive value, it is shifted to the right, and it is leading.
- Trial and error is the way to discover the right displaced moving average for you.
- The displaced moving average can be combined with other trading instruments to clarify signals from the market. Some of these are:
- Simple Moving Average
- Momentum Indicator
- Parabolic SAR
- Stochastic Oscillator
- Relative Strength Index (RSI)
- Chart Patterns
- Candle Patterns
- Retracement Levels
For another perspective on trading with displaced moving averages, check out this article from Pepperstone. I like how the site did a great job of using the DMA to capture the larger trend.


 Day Trading Indicators


