The 3 bar reversal pattern is one of the more common trading setups. The reason it’s so common makes it an easy target for newbie traders when they do their scans. The problem with the 3 bar reversal strategy when it comes to day trading is the setup can be found all over the place. So, in order to reduce the potential number of trades on an intra-day basis, we are going to apply a few requirements to this setup to filter out the noise.
- The stock must be trending hard in one direction
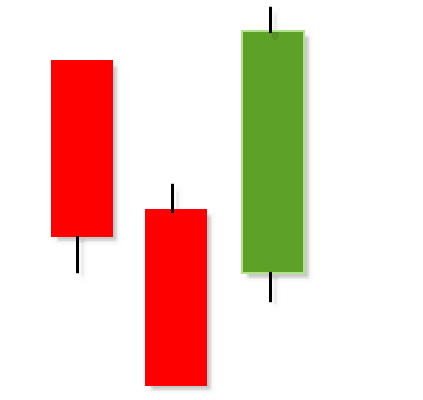
- The low or high of the three-bar formation must occur on the middle candlestick
- The third bar must close above the high of both the first and middle candlestick (the requirement of the formation is only that it closes above the high of the middle bar, but we are tightening this rule a bit to increase the odds in our favor)
As you see the picture below you will notice the painfully obvious the trend has reversed based on the closing of the third bar. That’s the entire point, we want to have a clear sign that the trend has reversed in order to reduce the number of false signals.

Example of when a 3 Bar Reversal Strategy works
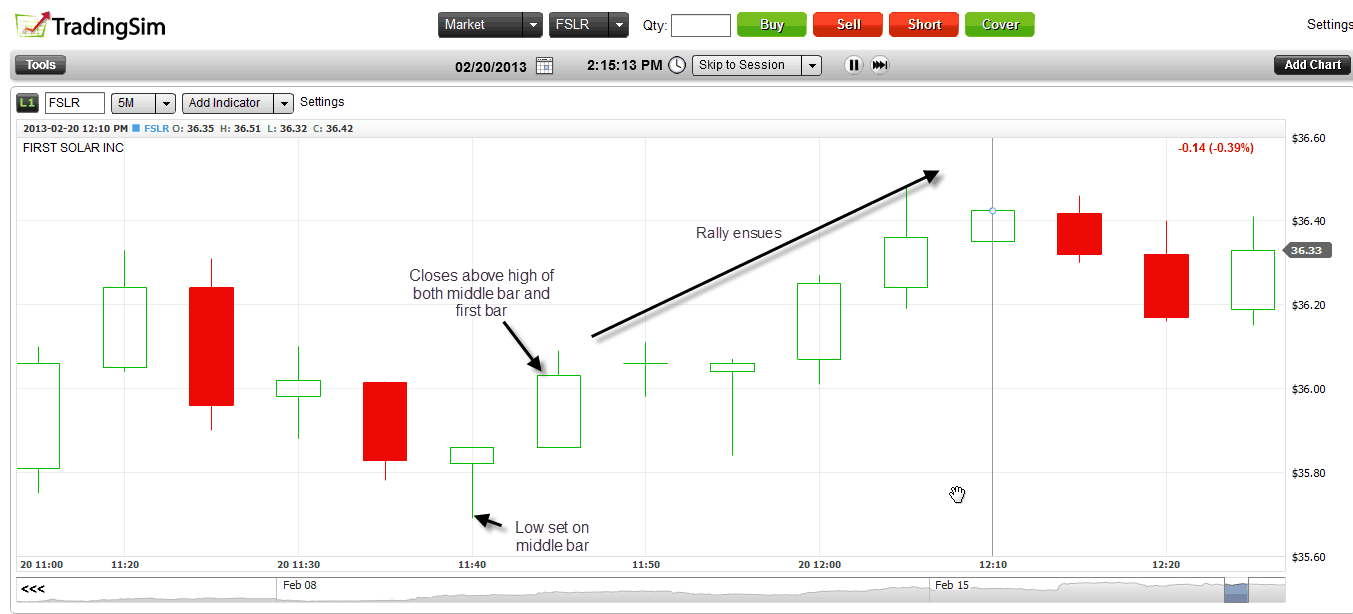
Let’s first establish a baseline of when the 3 bar reversal pattern works. For this example since we are day trading we will use the 5-minute time frame to identify the setup. The below chart is of First Solar (FSLR) from 2/20/2013. The stock made a low and then reversed sharply. The third bar in the formation closed above the high of both the middle bar and the first bar. Again, the 3 bar reversal strategy only requires a close above the high of the middle candlestick, but we are looking for a close above the first and second candlestick for insurance. In this particular setup, you would have purchased FSLR on the close at $36.03 which was 1 penny above the high of the first candlestick at $36.02. While the 3 bar reversal pattern does not have a specific exit trigger you can use a simple moving average or a price target to book your profits. A guiding principle is you want to maintain a 3 to 1 reward to risk ratio for all of your trades.

Let’s have a little fun and stretch the boundaries for the setup. What if instead of simply identifying the setup on one day, what if we look for setups that occur over a two-day period. This way we can honor the rules as defined for the 3 bar reversal, but wait for the third bar to occur on the next day. This way you can take advantage of the increase in volume and volatility that occurs on the open.
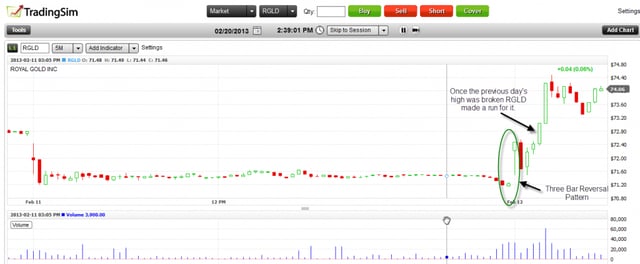
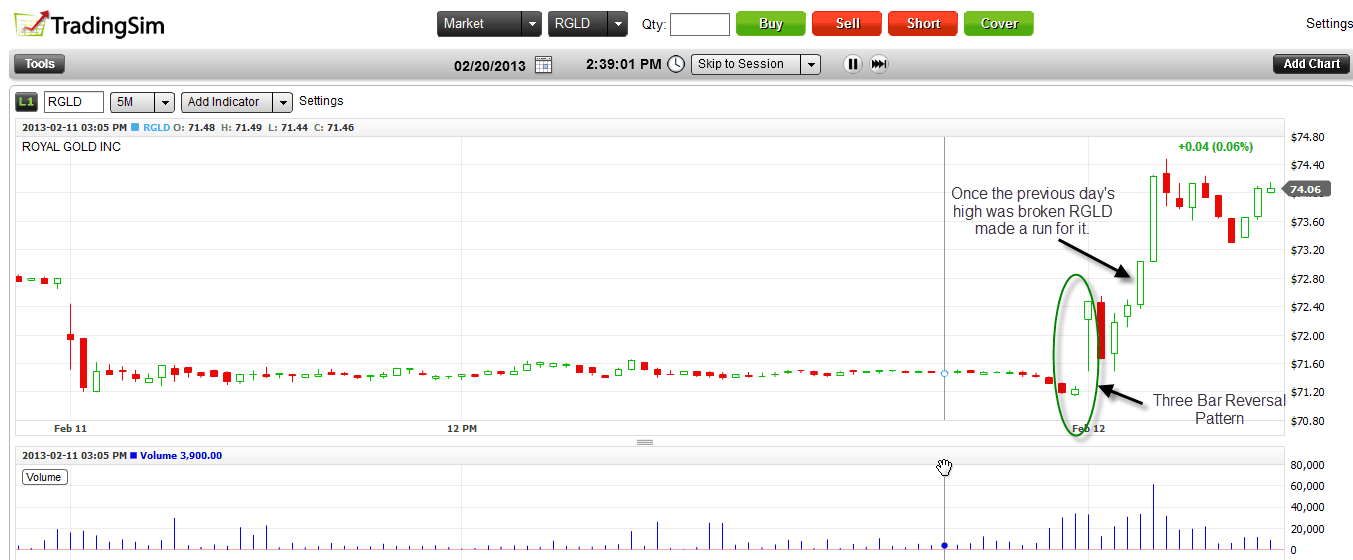
In our next example we will review a 3 bar reversal pattern for Royal Gold (RGLD) that developed over 2/20/2013 and 2/21/2013. You will see from the image RGLD had a gap down in the morning, traded flat for most of the day and then closed near the low. Then the stock had a gap up in the morning to close above the highs for both the first and second candlestick. This then triggered a rally of over 2% by 10am once RGLD exceeded the high set on 2/20/2013.
False Buy Signals using the 3 Bar Reversal Pattern
Day trading is really a test of wills as of late with the number of active participants trying to fake each other out on a daily basis. The 3 bar reversal is not immune to these games. In the next few examples we will cover false signals of the three bar reversal pattern and how you can quickly cut your losses.
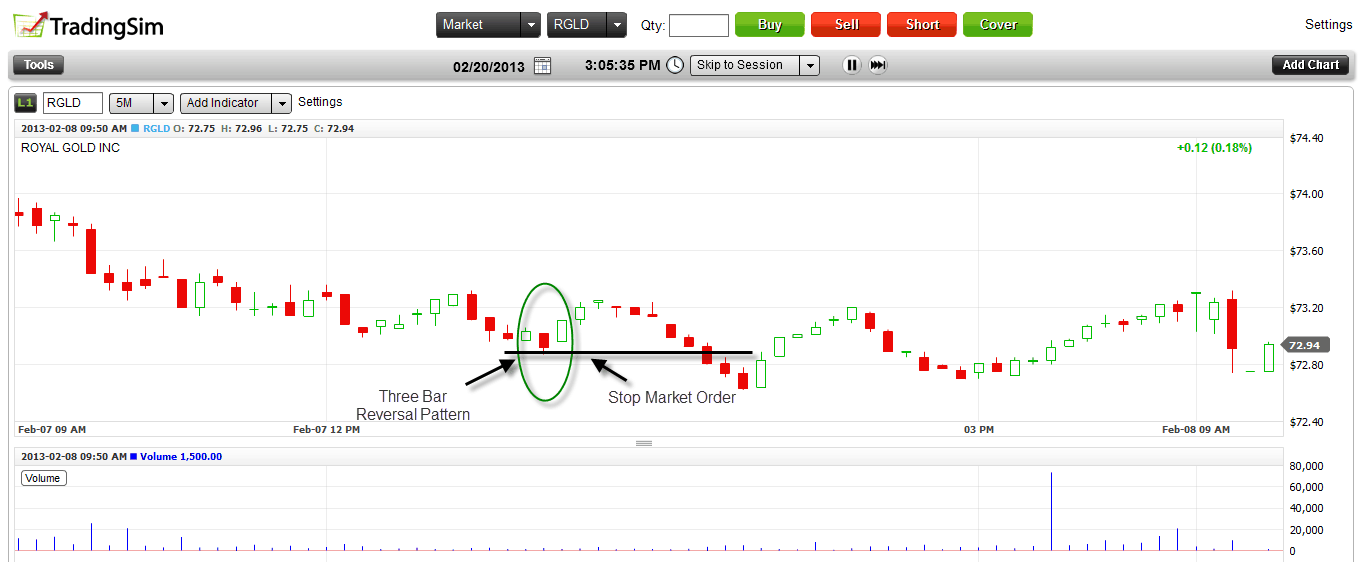
One reason the 3 bar reversal strategy will have a number of failures is due to the lack of volatility. When the market is really choppy the formation is nothing more than a pause in the action that does not result in any major upswing. For example, if we look at RGLD from 2/7/2013 you will quickly notice the stock was range bound from 10:30am until the close. At 1pm RGLD presented a three bar reversal pattern after a minor pullback. The third candlestick then closed above the high of both the first and middle candlestick. This gave the impression that a rally was brewing. Well two small dojis later and the stock rolled over. At this point you as a day trader have to acknowledge you are on the wrong side of the market. You will want to place your stop below the low of the middle candlestick.

Pros
The 3 bar reversal pattern can be easily found on the chart and can generate quick returns. As a day trader you will have no trouble finding these patterns in any type of market. Also, unlike other trading setups which are more prevalent in the morning or afternoon, you will find the three bar reversal pattern throughout the day.
Cons
The 3 bar reversal pattern used by itself can generate a number of false signals. Adding in additional confirmation items such as volume and volatility will increase the odds the market will go in your favor.


 Awesome Day Trading Strategies


