Day Trading E-Mini Futures with Moving Averages
Moving averages are one of the simplest and universal technical analysis indicators that are widely used across different markets and time frames. While the indicator can often be dismissed for its age or its simplicity, the fact that moving averages are widely used in the markets today is perhaps a testament to its importance and relevance in the markets even to this day and age.
The moving average indicator finds its roots from math, which has been an important element in technical analysis in the financial markets. Initially, the moving average that was used in the markets was a simple arithmetic average of prices. It was simple and quick to calculate, making this rather simplistic approach to technical analysis stand out from the rest.
The moving average was and still is, in fact a technician’s best friend since the days of charting by hand. As technology evolved and computers took over, the simple and trusty moving average has managed to evolve into the many different versions of moving averages that we come across today.
Still, despite the many forms of moving averages, the simple moving average and the exponential moving average are probably the two most widely used technical analysis indicators. It is not surprising to see the moving average indicators form the basis of many technical trading systems while at the same time adorning the screens of a professional trader talking on main stream financial media.
It is probably the simplistic nature of moving average that has made it one of the most widely accepted and used technical analysis indicator used in stocks, futures, forex and even bonds. Any beginner to trading and technical analysis would have no doubt stumbled upon moving average as one of the most basic of technical trading tools that they can use.
When using the term average, mathematically, it is referred to as the arithmetic mean or arithmetic average. It is a very basic statistical measure and providers a quick and easy way to find general level of values in a data set. Calculating the arithmetic average is quite simple, it is a sum of all the values in the data set is divided by the sum of the number of values.
Types of Moving Averages – Brief Introduction
Moving averages are primarily classified into the following types, which are the most commonly used types of moving averages.
- Simple moving average
- Exponential moving average
- Linear weighted moving average
- Smoothed moving average
Among these four, the simple moving average and the exponential moving averages are the more commonly used types of moving averages.
A simple moving average, as the name suggests is a very basic statistical measure and provides a quick and easy way to find general level of values in a data set. Calculating the arithmetic average is quite simple. The sum of all the values in the data set is divided by the sum of the number of values.
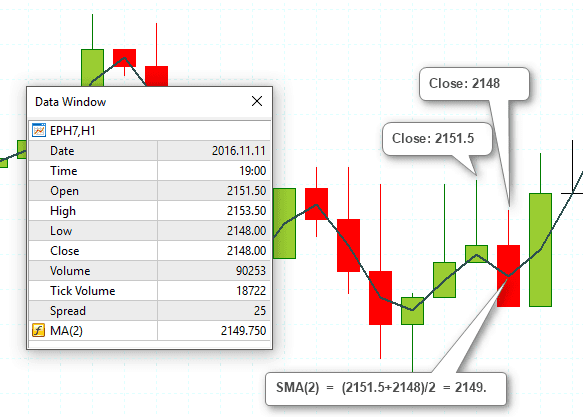
Calculating the simple moving average (2 period close)
The Simple moving average is still one of the most widely trusted technical analysis indicator with many professional traders keeping an eye on the 200 day Simple Moving Average, also called the 200-day moving average. The 200-day MA is importance simply because it is one of the widely used periods on the simple moving average on a daily chart with many mechanical trading systems and algos built around price and the 200-day MA. Other most commonly used settings for the moving averages include, 100, 50, 20, 10 with some specific settings such as 21, 34 and 55. Despite the wide range of look back periods traders should note that there is no “perfect setting for moving averages”. At the end of the day, it comes down to how well a trader can understand price, the markets and the moving averages that are used on the chart.
The flexibility of the moving average comes from the fact that the technical indicator can be used on any instrument and across any time frame, start from the 1-minute chart to the monthly charts. Every day trader has their own preference on the look back period of the moving average with some arguing that their look back period of the MA being superior to other. The moving average indicator is also used on other custom or time independent charts such as Renko or Point and Figure charts where only price is the variable on the chart.
The exponential moving average is another alternative to the simple moving average. The main difference between the two, being that the exponential moving average tends to be more receptive to the latest prices than the simple moving average which treats all values in the data set equally.
The reasoning behind this stems from the fact that an exponential moving average gives more weightage to the most recent prices in the data set thus making the moving average more sensitive to the current data. When comparing the simple moving average to the exponential moving average you can see how the EMA is more sensitive to price than the SMA.
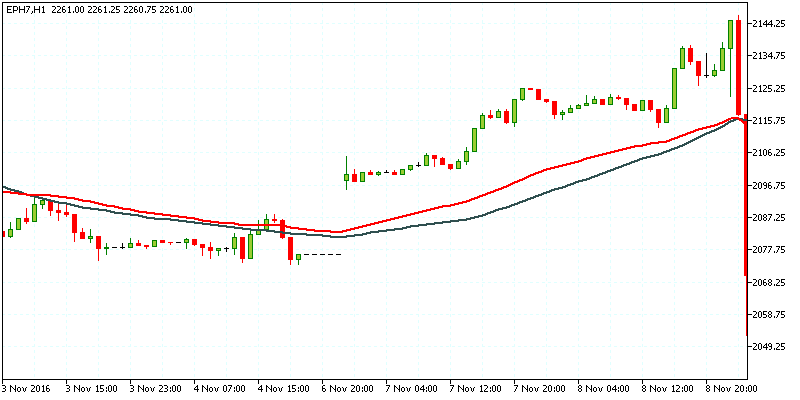
Comparison of 50 period SMA (Black) and EMA (Red)
In the above chart the Red line shows the 50-period exponential moving average and the Black line shows the 50-period simple moving average. On a normal chart (no gaps or volatile price movements), both the EMA’s tend to print nearly similar prices. However, once you factor in volatility such as price gaps, sharp movements in prices, the SMA and EMA start to diverge. While the SMA continues to print a steady moving average line, the exponential moving average becomes more sensitive to prices and as a result the EMA also shows volatility in the average prices that are plotted.
While there is no answer to whether the simple moving average or the exponential moving average is better, traders need to apply the respective moving average depending on the instrument and the market that they are trading. For example, a steady trending market on a daily chart can be better used for the simple moving average while a more volatile intraday trading would see the exponential moving average offering better insights to the day trader.
When traders make use of two moving averages, the crossovers off the short term and the long term moving averages can signal bullish or bearish trends.
Typically, when a short term moving average crosses below the long term moving average, it is known as the Death Cross. Grim as it sounds, the death cross of a 200 and 50 moving average for example merely denotes a bearish trend in the markets. Likewise, when the smaller moving average crosses above the long term moving average, it is known as the Golden Cross which signals a bullish trend that is evolving in the markets. The Death Cross and the Golden Cross are two terms that are often used in the main stream media especially for the equity markets and thus is quite relevant to the futures markets.
Traders typically make use of two or more moving averages in order to determine the trends in the market. This is done by using a shorter period moving average and a longer period moving average.
The 10 period and 20 period Exponential Moving Average
Among the different periods for the exponential moving average, the 10 and 20 period EMA’s are the most common. The values simply represent the recent 10 or 20 prices (open, close, high or low) on the price chart. When applied to the daily time frame, the 10 and 20 periods EMA simply show the monthly and half monthly average prices.
It can also be used on 1-hour chart and can depict the short term intraday trends in the market.
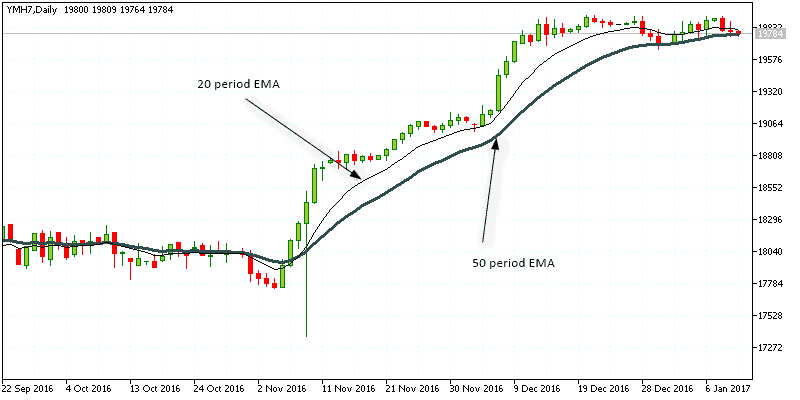
10 period and 20-period EMA on daily chart
The above chart shows how a combination of the 10 and 20 period EMA results in the price trend being defined clearly. The bullish crossover on 9th November, where the 10 period EMA crossed above the 20 period EMA resulted in strong trending markets validated by the short term EMA staying above the long term EMA.
The 10 and 20 period exponential moving averages are one of the most commonly used technical analysis indicators for trading the emini futures contracts such as the Dow (YM), S&P500 (ES), Nasdaq (NQ) to name a few. Using the two moving averages, traders can use the indicators to swing trade or day trade the futures markets. Due to the simplicity of the moving averages, there are many mechanical, discretionary as well as high speed algorithms that are built revolving around the moving averages and the price.
Besides being used a trend indicator, the moving averages can also serve the purpose of identifying potential support and resistance levels in price. When a trader can find such levels and combining this information with the moving average, a simple yet robust trading system can be formed.
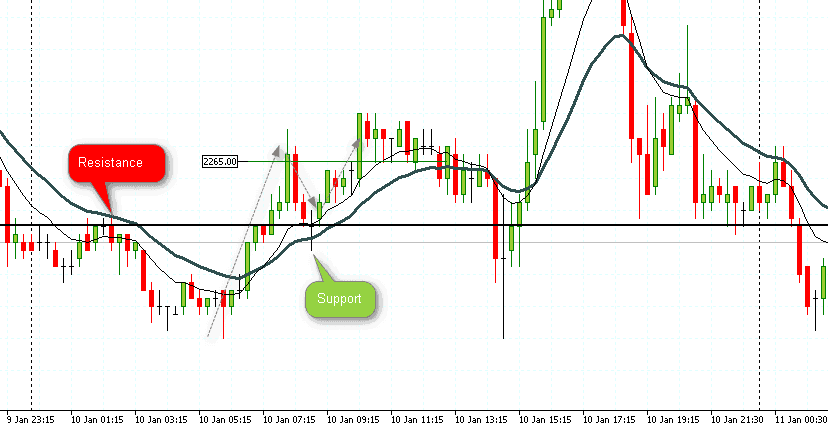
10,20 EMA on Emini futures (Support-Resistance)
The above chart shows one of the ways the moving average indicators can be used. Starting from the left, you can notice the resistance level that was formed by a bearish reversal in prices within the downtrend indicated by the 10EMA trading below the 20EMA. Few sessions later, the 10EMA rises above the 20EMA to signal bullish sentiment in the emini futures market. After a brief rally, price pulls back right to the previously identified resistance level when support is formed. This is also marked by the doji candlestick pattern and a bullish candlestick there after indicating a bullish continuation in prices.
Following the bounce off this old resistance forming to new support, price makes another attempt to rally before starting to slip back. You will also notice how in the few sessions later, price posts another reversal but with a lot more volatility near this identified level.
The above example illustrates just one of the many ways futures day traders can use the exponential moving average to day-trade the emini futures markets. Here’s a brief bullet list of some of the ways traders can use the moving average indicators.
- 10/20 EMA bullish and bearish crossover signals
- Buying dips in an uptrend or selling rallies in a downtrend
- Divergence based set ups
- Finding support and resistance levels using price reversals and trends depicted by the EMA’s
- Identifying strong momentum based on the slope of the short term moving average in relation to the long term moving average
- Building a moving average envelope of high and low prices to identify breakouts from the average trending prices
The different types of uses for the moving averages have made it one of the cornerstones of many trend following strategies. Typically, moving averages are also used alongside technical oscillators such as the Relative Strength Index (RSI), Moving Average Convergence Divergence (MACD) or the Stochastics oscillator, all of which aim to capture the rise and fall in momentum. Combined, the MA’s and the oscillators tend to provide a fairly robust picture of the markets and help in determining to pick the dips and rallies in a trend.
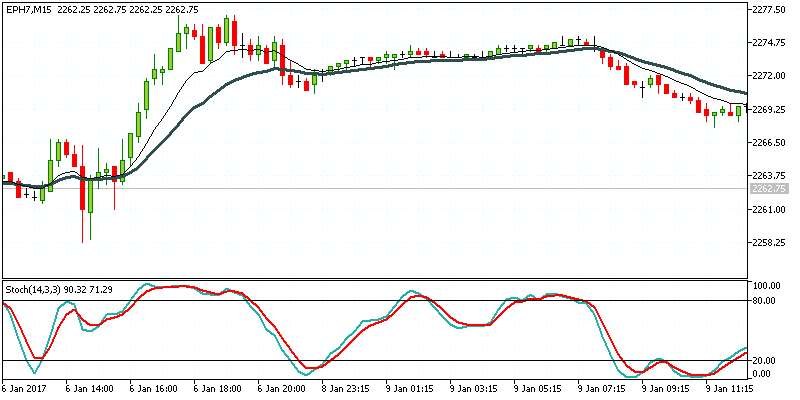
10, 20 Exponential Moving Average with Stochastics Oscillator
To conclude, the moving averages might be easily dismissed by some traders for its simplicity and its antiquity. However, the indicator has stood the test of time and is derived from a simple piece of math and the general logic surrounding it. Now-a-days, there are many different versions of the moving averages which claim to offer something new for traders. It is not surprising to find traders continually look for the latest improvement to the moving average, when the fact remains that the simple and exponential moving averages are probably one of the best indicators out there.
Due to the fact that some EMA and SMA periods such as 200, 100, 50, 20 and 10 are so closely watched by most traders, it has become a self fulfilling prophecy. For day traders who are just getting started, the moving averages (whether you are using the simple moving average or the exponential moving average) are probably one of the best places to start in your technical analysis journey.


 Day Trading Indicators


