It will be important to understand a few key elements before we dive into the specific strategies; such as volume, volatility, and risk tolerance. You will need to understand these building blocks in order to have a more complete understanding of morning gap trading. Remember, you have a very short time window to execute your trades and you need to be able to quickly process all the clues that are given to you.
Volume is probably the most important tool that you can have available to you. We have done an extensive write-up on how to read the time and sales window (aka. Tape reading) which will provide you with the trading activity of each stock. As a trader, you need to understand the significance of high or low volume, especially when it occurs at important support and resistance levels.
When we see high volume attacking a support or resistance area and pushing through it, it is a sign that the sellers or buyers are in control and that enough energy has been exerted to actually signal a continuation in trend for a larger period of time. Generally speaking, you want to see a volume picking up as it approaches a resistance level and takes it out with heavier volume in comparison to the previous volume figures recorded in the past at that same price level.
Light volume; however, is not necessarily a bad thing. Light volume can allow the stock to ramp much higher and much faster than if there was heavy interest in the stock. This can be a good thing when the stock is in a confirmed uptrend and you are riding the trend higher. But always be cautious of a high volume spike after a sustained uptrend, this could put a wrap on the move, at least for the short term.
Volatility
Be aware that it is very important to understand the principle of action and reaction. For example, if a stock moves substantially higher over a 3 day period without any major retracements, a trader should prepare for a reaction that would be commensurate to the previous move higher.
When we see stocks moving extremely fast, up or down, there is a risk for high levels of volatility on the opposite side and this can signal large moves up and down, where emotions take over and technical analysis gets thrown out the window. Keep this in mind when you select the stocks that you trade. Higher volatility leads to larger swings which lead to irrational market movement.
For this reason, I find it more beneficial to trade larger-cap stocks which attract the big money, thereby reducing the massive levels of volatility that can be seen in small-cap stocks.
Risk Tolerance
This sounds simple, but trust me, when you are in the trade it isn’t so easy. Define your trading risk profile before you start trading. Define the amount of money you are willing to risk and understand if a potential trading candidate fits in line with your risk profile. Far too many traders think that they can approach a Dow component in the same way that they approach a Chinese internet stock. Depending on your trading rules, a high volatility stock may take you out of an otherwise good trade due to the violent whipsaws that occur in these stocks. If you cannot emotionally handle large swings, don’t trade the stock. There is always another trade. If you still feel the need to trade these stocks, dramatically decrease your position size. Remember, consistency is the key in this game and you do not want to disrupt that with large losses in the account, no matter how much of an itch you get.
Opening Gap Trading Strategies
#1 – Gap and Go Strategy
The first morning gap trading pattern we will discuss is the gap and go strategy.
The gap and go strategy starts with a bullish gap on the opening bell, followed by a further price increase. It is crucial that the trading volumes are high at the time of the gap. After the gap, volumes will decrease, but still will be relatively high.
Essentially after the gap, the stock never looks back. This prevents any opportunities for short traders to exit their positions.
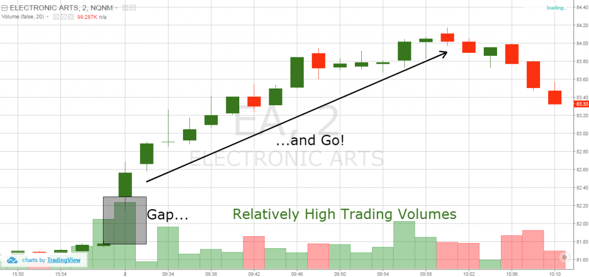
Gap and Go Strategy
Above is a 2-minute chart of Electronic Arts from Sep 2, 2016 displaying a gap and go strategy.
See that the trading day starts with a bullish gap with high trading volumes, followed by further bullish price action.
The price literally runs straight up for 30 minutes without ever looking back.
While this rally ended around midday, there are times when a stock will run the entire day.
Your goal with trading this strategy is to eat as much of the gains as humanly possible.
Let’s review another gap and go setup.
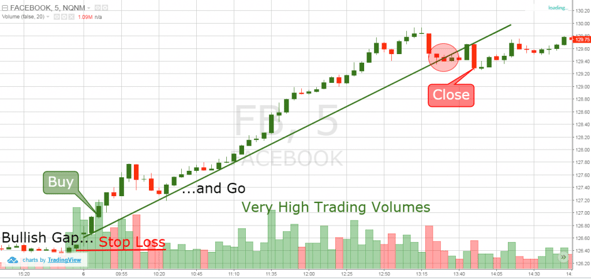
Gap and Go Trading Strategy
This time we are looking at the 5-minute chart of Facebook Incorporated from Sep 8, 2016.
The trading day starts with a bullish gap.
The first three 5-minute candles are bullish. This is when trading volumes are highest. This is why we assume that we might have a gap-and-go pattern on the chart and we buy Facebook.
Next we of course place a stop loss, which is the one thing I hope you get out of the blog posts on the site – always use a stop loss.
We place the stop loss at the bottom of the last candle from the previous trading session.
Notice that the FB enters a strong bullish trend after the morning gap.
A simple exit strategy is to draw a basic trend line on the chart and to hold the stock until this level is breached.
On the chart, we have indicated with the red circle the point at which the stock breaks the uptrend.
However, since the trend is really strong, a single candle below the trend cannot be taken as a valid signal to exit the trade.
This of course is very subjective, so you need to have a ton of self-discipline before implementing such a strategy.
For this reason, we wait for the FB price to break the swing low after the most recent high. Notice that the price ultimately broke this swing low, at which point we closed the trade.
#2 – Gap Pullback Buy Strategy
The gap pullback strategy is likely the most widely used gap trading strategy in the market.
This gap pullback strategy is similar to the gap and go strategy in that the gap is bullish and you will want to go long the trade.
Once you get beyond these basic elements, the two gap setups are quite different.
In order to get a valid gap pullback buy signal, you first need to see a bullish morning gap with high trading volumes. Then you need a price pullback with quiet volume.
A valid gap pullback buy pattern is likely to reverse the pullback move somewhere below the mid-point of the gap. The expectation is that the stock will then reverse back to the high of the day and enter a strong bullish trend.
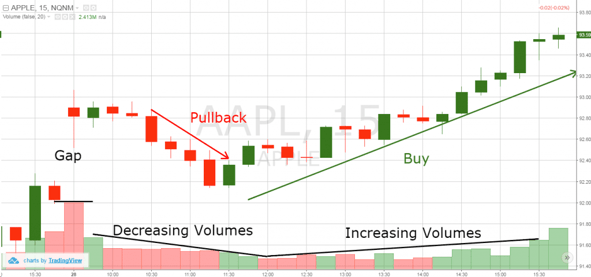
Gap Pullback Trading Strategy
Above is the 15-minute chart of Apple from June 28, 2016.
See that the trading day starts with a bullish gap on the opening bell. The volumes are high as the stock trends higher.
However, the price begins to falter and ultimately slips through the mid-point of the gap and fills the gap completely. Meanwhile, volumes are tapering off as Apple trends lower.
Then we see a reversal and increasing trading volumes.
Is your head spinning yet from the volatility in the market? One minute it is up, the next you have no idea which way you are going.
This is the nature of trading and the better you get at accepting the uncertainty, the better off you will be in the long run.
The reversal of the pullback often happens after a reversal candle pattern on the chart. If you see a bullish candle during the pullback, you could potentially be seeing the beginning of a new bullish move.
Once you see this reversal point, you will want to go long the stock.
A stop-loss order should be placed below the gap low. This way your trade will be protected against a false signal.
There are a couple of targets with the gap pullback setup.
The first one is located at the top of the gap. The second larger target can be set using Fibonacci extensions or just monitoring the price action of the stock.
Let’s review a gap pullback buy strategy to further clarify these points.
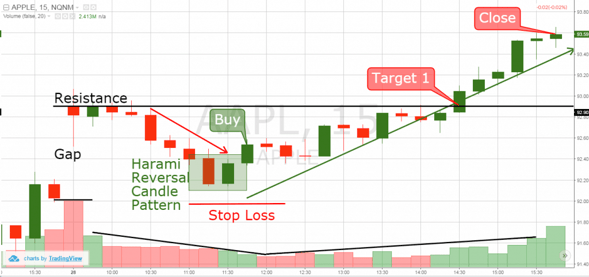
Apple – Gap Trading Strategy
This is the same Apple chart we discussed above. This time, we have added specific trade signals on the chart.
The black horizontal line on the image indicates the resistance area formed right after the gap. See that there are four candles after the gap creation, which are crawling under this level.
The price finally backed off this resistance level and filled the gap.
As Apple is filling the gap, the volumes drop off substantially.
Then a harami reversal candle pattern appears on the chart. This indicates that the price action might reverse.
The next candle after the harami pattern goes above the candle figure and confirms the potential increase. We use this candle to buy Apple.
The price then begins to rally higher.
We place a stop-loss order right below the lowest point of the gap. This is shown with the red horizontal image on the chart.
Eleven periods later we see that AAPL reaches the first target of the pattern, which is the high of the morning gap. The rally then rallies through the gap high.
The trade then could be held until the end of the trading session. You can exit the market a few minutes prior to the closing as shown on the chart.
#3 – Morning Reversal – Gap Fill Strategy
The next gap approach is when you place a trade counter to the primary trend in hopes of filling the gap.
Therefore, if the stock opens with a bullish gap, the price could fill the gap on the chart with a bearish move.
The gap usually appears with high trading volumes.
Then the volumes decrease simultaneously with the pullback.
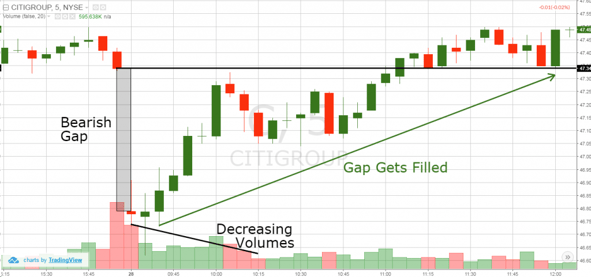
Gap Fill Strategy
This is the 5-minute chart of Citigroup from April 28, 2016.
See that the gap opens with high trading volumes, then the volume drops off a cliff as the price action begins to trade sideways.
This illustrates the inability of the bears to push the stock lower.
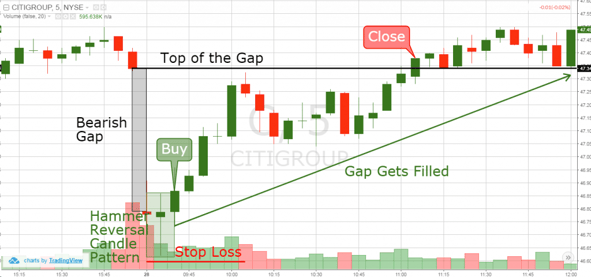
Reversal Gap Trading Example
After the bearish gap we have another tiny bearish candle.
The candle appears to be small due to a drop in volume. The next candle is the well-known hammer reversal candle pattern. This implies that the price action could reverse and fill the gap.
The volume on this candle is even lower. The next candle is bullish and breaks the top of the hammer.
This confirms the reversal potential of the pattern and we buy Citigroup. Our assumption is that the price action could start a move opposite to the gap.
We place a stop-loss order right below the low of the hammer.
The price continues to increase and almost reaches the top of the gap. However, a slight hesitation holds the price from reaching our target. After two consolidations, the price increases and reaches the top of the gap. This completes our target and we exit our morning reversal gap fill trade.
Trading the gap for a living is a common approach to tackle the markets in the morning hours.
What I have noticed after logging thousands of trades is that buying the pullback is the safest risk-reward ratio.
The downside is you may have to sit in the trade for an extended period of time to see if the stock can actually exceed its previous high.
Conclusion
- There are three basic tools that could help you assess morning gaps:
- Volume – High volumes are always a confirmation of the price’s direction. Low volumes indicate that the price action is not very persuasive.
- Volatility – Remember this: “For every action, there is an equal and opposite reaction” – Newton
- Risk – You should always be aware of the loss you are willing to take. Morning gaps involve a high dose of trading volume and volatility. This means that many unexpected things could happen on the chart.
- Morning gap trading strategies:
- Gap and Go Strategy: The price creates a bullish gap and continues to trend upwards without ever looking back.
- Gap Pullback Buy Strategy: The price does a bullish gap but the price pulls back afterwards. The mid-point of the gap is crossed and the pullback nearly reaches the low of the gap. The assumption is that the price will reverse and break the gap high.
- Morning Reversal Gap Fill: The price gaps up or down on the market opening. The gap then gets filled in the opposite direction. You can use this as an opportunity to go counter to the primary trend.


 Intro to Stock Charts


