Symmetrical Triangle Chart Pattern

symmetrical-triangle_0

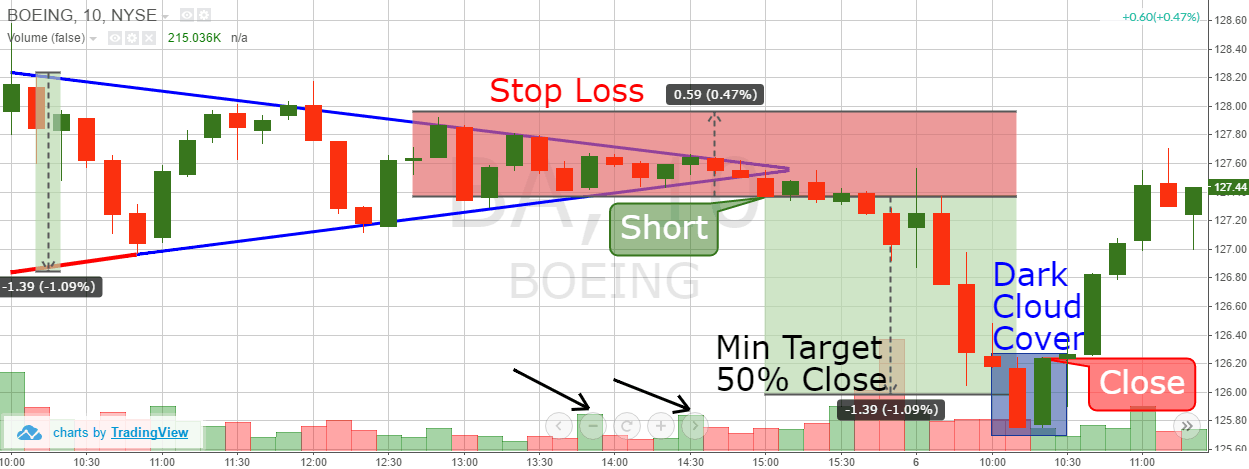
To practice the symmetrical triangle example detailed in this article visit http://tradingsim.com. Symmetrical Triangle Definition A symmetrical triangle is the most common triangle chart pattern. It is comprised of price fluctuations where each swing high or swing low is smaller than its predecessor. This coiling price movement creates a structure of a symmetrical triangle. As a Read the full article →

Double Top – Reversal Chart Pattern

double-top-breakout

Double Top Definition Double Top is a chart pattern with two swing highs very close in price. This pattern can be seen in all time-frames. There are a few requirements to classify a chart pattern as a double top: Two peaks that are near equal in price Equal distance in terms of time between highs Read the full article →

Diamond Chart Formation

diamond-chart-formation

Diamond Chart Pattern Definition A diamond chart formation is a rare chart pattern that looks similar to a head and shoulders pattern with a V-shaped neckline. Diamond chart reversals rarely happen at market bottoms, it most often occurs at major tops and with high-volume. Since diamonds are a variation of head and shoulders tops, you Read the full article →

Bull Trap – Chart Reversal Pattern

bull-trap

Bull Trap Definition A bull trap occurs when longs take on a position when a stock is breaking out, only to have the stock reverse and shoot lower. This counter move produces a trap and often leads to sharp sell offs. Bull Trap Setup Bull traps have a very basic setup. You will want a Read the full article →

Bear Trap – Chart Reversal Pattern

bear-trap

Bear Trap Definition A bear trap occurs when shorts take on a position when a stock is breaking down, only to have the stock reverse and shoot higher.  This counter move produces a trap and often leads to sharp rallies. Bear Trap Setup The bear trap chart pattern is a very basic setup.  You will Read the full article →