5 Tips for Confirming and Trading the Bump and Run
Sep 4, 2016
Written by: Al Hill
The bump and run chart pattern is a rare formation. So, to make things simple, we will walk you through 5 easy steps for identifying the pattern.
I am not going to stop there though. I will also provide you a clear strategy to trade this pattern for profits in the market.
The bump and run reversal chart pattern a.k.a. BARR is formed when the price trend creates an impulsive move higher on the chart. The price action then reverses and the stock has a rapid decrease, breaking its trend line.
The bump and run pattern is mostly visible on larger time frames such as the daily. However, the setup can work just as well on intraday charts, you will just have to search long and hard to find the pattern is it is a rare formation.
bump and run
Above you see a standard bullish trend line. The trend consists of four bullish trend impulses. As you see, the first three are relatively on par with one another.
However, the last impulse is relatively big, thus creating the “bump” on the chart.
After the bump is completed, the price starts losing its bullish characteristic. Suddenly, the price action pulls back rapidly, breaking the green bullish trend. The rapid reversal of the trend is the “run” component of the pattern.
Types of Bump and Run Patterns
The bump and run chart pattern has a very strong reversal characteristic.
There are two types of bump and run patterns – bearish and bullish.
Bearish Bump and Run
The bearish bump and run pattern starts with a standard bullish trend.
Suddenly, a relatively big bullish trend impulse appears on the chart – the bump. After new highs are reached, the price action reverses, tests the support line, and breaks it with a vengeance.
This line break is the start of the run and if you are able to catch a stock at this point, you stand to make a significant gain on the trade.
Bullish Bump and Run
The bullish bump and run is the same setup of the bearish pattern, just on the opposite side of the trade.
The bullish bump and run pattern starts with a standard bearish trend. Suddenly, a relatively big bearish trend impulse appears on the chart – the bump. After new lows are reached, the price action reverses, reaches the bearish trend line, and breaks it upwards to start a fresh bullish move – the run.
5 Tips to Confirm a Bump and Run Chart Pattern
The structure of the bump and run pattern is very specific. Therefore, you should carefully examine the chart pattern before placing a trade.
1) Angle of the General Trend
First, you need to identify a trending stock. The inclination of the pattern should be anywhere between 30 and 45 degrees on the chart.
2) Angle of the Bump
The bump on the chart should definitely be steeper. After all, it is a trend impulse, right? The valid bump would have an inclination anywhere between 45 and 60 degrees on the chart.
3) Trading Volumes
Volumes are crucial for the validity of the bump and run formation. During the preceding trend, the volumes are usually low. Then the bump appears on the chart and volumes will tend to spike higher.
This helps the stock accelerate higher, creating the actual bump on the chart.
4) Bump and Run Pattern Sizes
Another crucial aspect of the bump and run structure is the size of the bump compared to the previous impulses.
S1: The first size is the vertical distance between the top of the price action prior the bump and the leading trend line.
S2: The second size is the vertical distance between the top of the bump and the leading trend.
Then you need to compare these two sizes. To confirm the validity of the bump and run pattern, S2 needs to be at least twice the size of S1.
5) Confirmation of the Bump and Run Reversal Pattern
The actual confirmation of the pattern comes with the breakout through the leading trend line. After the bump is created, the price is expected to initiate a move toward the trend line. When the trend is reached, it is possible that the price action hesitates for a while. However, if the pattern is valid, you will see a breakout through the trend. If the breakout appears, then the pattern is valid and you have confirmation to pursue its potential.
bearish bump and run pattern
Above you see a bullish trend and a BARR pattern. Our bump and run analysis manages to find the 5 rules needed to confirm the validity of the pattern:
1) We have a 30 Degrees bullish trend (green).
2) Suddenly, the price shoots up to 60 degrees, creating the bump (blue).
3) The trading volumes were decreasing during the creation of the leading rend. In the red square, we see that the volumes are picking up in the time of the bump creation.
4) We measure the two sizes and we confirm that the bump size is more than twice the size of the last impulse prior to the bump.
5) We get a confirmation of the pattern in the moment when the price action reverses and breaks the leading trend. This is shown in the red circle on the chart.
Since we have these five symptoms on the chart, we confirm the validity of the bump and run pattern.
Bump and Run Trading System
Now that you have the five tips to confirm a bump and run chart pattern, we will dive into a trading strategy.
Bump and Run Trade Entry
The rule here is clear. You need to open a trade the moment you confirm the validity of the pattern and spot a breakout through the leading trend.
If the bump and run indicator is bullish, then you should trade the bullish breakout with a long position.
If the bump and run indicator is bearish, then you should trade the bearish breakout with a short position.
Bump and Run Stop Loss
The bump and run formation involves high trading volumes. Therefore, your trade is likely to be subject to a lot of volatility.
Therefore, if the price decides to move against you, this could happen in a flash. Therefore, I advise you always to protect your bump and run trades with a stop-loss order.
A good place for your stops when trading bumps and runs is the midpoint between the top of the bump and the moment of the breakout.
bump and run stop loss
The above image illustrates the proper placement of the stop loss when trading the bump and run pattern.
We take the distance between the level of the big candlestick and the moment of the breakout. Then we place the stop in the middle of this distance.
Bump and Run – Profit Target
The expected price move during a BARR trade is indefinite. In this manner, we do not have a clear picture of how long the reversal could last. For this reason, I recommend you apply price action rules when trading with the bump and run reversal indicator.
Stay in your trades as long as the price action creates tops and bottoms inclined in your favor. Also, watch out for reversal chart patterns. A valid reversal chart pattern could always provide an on-time exit point from a trade.
Bump and Run Trading Example
Since we have covered how to identify the bump and run pattern, plus the trading rules, it is now time to walk through a real-life trading example.
bump and run trading example
Above you see the daily chart of AT&T from July 2015 through April 2016. The image illustrates a bullish bump and run pattern, where we will apply our trading rules.
The first thing we do is identify a bearish trend on the chart.
We draw the green trend line and measure the angle of the decline. The trend is declining at 40 degrees and then comes the bump.
The price drops rapidly under 60 degrees with high trading volumes. This confirms a bearish bump on the chart.
The price action reverses afterward, then we measure the size of the bearish bump.
The orange arrows compare the bump with the previous trend impulse. We realize that the bump is almost three times bigger. This creates a very strong implication that a valid bump and run pattern is about to be confirmed.
However, we need to see a breakout through the green bearish trend in order to identify a valid BARR pattern and to enter a trade.
We buy AT&T when we see a breakout in the trend. At the same time, we place a stop loss at the midpoint of the distance between the tip of the bump and our entry point. This is shown with the red horizontal line on the chart.
The price quickly begins to increase after entering the trade.
See that the first correction is a bit steep, but leaves our stop untouched. The price jump then increases its intensity, which is shown with the pink lines on the chart. As you see, the upward movement is exponential.
Suddenly, the price action creates a head and shoulders reversal chart pattern. You can see the figure in the red rectangle on the chart. The black line in the rectangle represents the neckline of the pattern. The price action then breaks the neckline downwards, confirming the authenticity of the reversal figure. This creates a strong sell signal on the chart. Therefore, it is better to close the trade in this case on an assumption that the price action might start a decrease.
Conclusion
The bump and run Reversal (BARR) pattern is a trend-related formation.
The pattern starts under a regular trend. Then the price action creates a big trend impulse. Suddenly, the price action reverses rapidly and breaks the leading trend line.
There are two types of BARR patterns based on the potential they create:
Bearish Bump and Run – It starts with a bullish trend, and it is supposed to reverse the price action.
Bullish Bump and Run – It starts with a bearish trend, and it is supposed to reverse the price action.
5 Tips to Confirm a Bump and Run Chart Pattern:
Find a trend line with an inclination between 30 and 45 degrees.
Discover a sharp trend impulse, which is inclined between 45 and 60 degrees. This would be a potential bump.
Confirm relatively high trading volumes in the time of the impulse. This is now a confirmed bump.
Confirm that the size of the bump is at least twice bigger than the previous trend impulse.
Validate the authentic pattern when the price reverses and breaks the leading trend line.
The trading rules of the bump and run reversal pattern are:
Open a trade the moment when the price action breaks the trend line and confirms the pattern.
Place a stop loss on the midpoint of the distance between the tip of the bump and the moment of the trend breakout.
Use price action rules to determine when to exit from your trade.
A breakout of a range presents an opportunity to get long or short. But how do you know when the range has enough “juice” to generate a trending move. As day traders you will have a slew of data to...
How to Trade Diamond Chart Patterns – Winning Strategies
Diamond Chart Pattern Definition A diamond chart formation is a rare chart pattern that looks similar to a head and shoulders pattern with a V-shaped neckline. Diamond chart reversals rarely happen...
The 3 bar chart pattern is one of the more common trading setups. The reason it’s so common makes it an easy target for newbie traders when they do their scans. The problem with the 3 bar reversal...


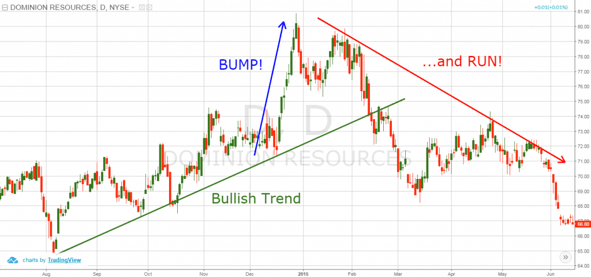
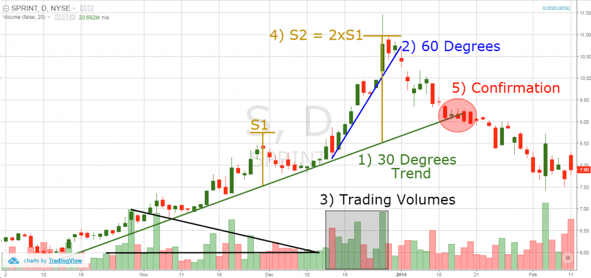
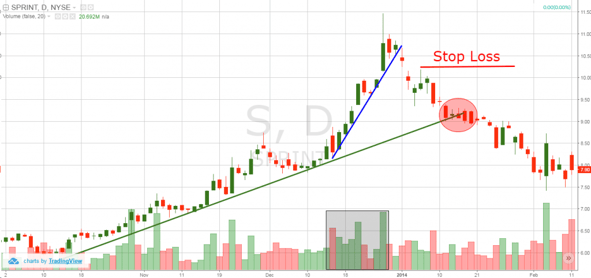
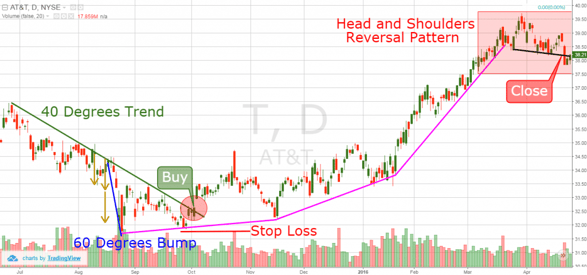


 Chart Patterns


