We can all agree that the bullish percent index (BPI) is a market breadth indicator that we can use to gauge market health.
But is the indicator something you should use when trading? More importantly, if you do use the indicator when trading, when and how should you place your orders.
Wellin this post, we will dissect how the BPI can be used to navigate the waters and some specific techniques you can use to increase your odds.
Why Should You Care About the BPI?
The BPI indicator is calculated by taking the total number of issues in an index or industry that are generating point and figure buy signals and dividing it by the total number of stocks in that group. The basic rule for using the bullish percent index is when the BPI is above 70%, the market is overbought, and conversely, when the indicator is below 30%, the market is oversold.
The most popular BPI is the NYSE Bullish Percent Index, which is the tool of choice for famed point and figure analyst, Thomas Dorsey. The bullish percent index is generally plotted on with a two-point box size. Later in this article, we will cover how to confirm bull and bear markets.
Bullish percent index or BPI for short might seem as just another fancy name for a market breadth indicator. Between the BPI and many other similar indicators, one might wonder the need to use this indicator.
Well, the BPI is an indicator for the stock markets which is quite unique. In fact, the Bullish percent index is so unique that you won’t find this indicator easily available. Not all charting platforms have the Bullish percent indicator readily available.
What does this information tell you? It simply means that the Bullish percent index is not that commonly used. And more importantly, it takes a bit more than the usual approach when using the BPI indicator in your technical analysis.
That in itself can be a major put-off for many traders. But dig deeper and you will find some powerful information that the BPI can alert you to.
One of the most common questions a day trader would ask is how to know when to buy and when to sell.
It is an open secret that many a time, the average trader Joe ends up holding the bag. This article from the Guardian talks of how retail traders tend to constantly lose money in stocks.
Numerous studies have been done on how trading psychology works. The retail trader is often the last to ride the gravy train. In other words, most retail traders end up buying stocks at the highs and selling at the lows.
But what if this same market psychology is used to your own benefit?
If you are still wondering what the Bullish percent index indicator is all about, let’s start from the basics.
What is a market breadth indicator?
Market breadth indicator, as the name suggests is a technical indicator drawn up a mathematical formula. It measures the number of advancing and declining stocks.
This simple formula shows the number of market participants participating in the rally or the decline of the stocks. In other words, a market breadth indicator shows you the overall market sentiment.
But that’s not all!
Market breadth indicator also shows you and can even validate the strength of a trend.
Let’s put it this way.
What if you knew that the market rally was validated by an increasing number of market participants who are bullish? This tells you that the rally is genuine as there are an increasing number of participants who are bullish on the stocks.
But how does this information benefit you?
Well, the market breadth indicator is an ideal way to gauge the health of the market at any point in time. If you know how to use a market breadth indicator, you will know where the markets are heading.
The market breadth indicator also tells you whether money is flowing in or out of stocks. But there’s an important caveat to this.
A market breadth indicator will not tell you which stock or sector is driving the gains. So that’s something to bear in mind. And this is where most day or swing traders get it wrong.
A market breadth indicator requires some thinking and logic when using the indicator. You simply cannot add the indicator and expect it to tell you where to buy and where to sell. This is one of the main reasons why so many retail traders often end up losing money.
Now that we know what a market breadth indicator is, the next step is to figure out what this indicator is all about.
What is the Bullish percent index indicator?
The Bullish percent index is calculated based on the total number of issues in an index. The index could be the S&P500 or the Dow Jones or even the Russell 2000. The market sentiment is shown based on the point and figure charts which generate buy and sell signals.
When the bullish percent index is above 70%, the general premise is that the sentiment is overwhelmingly bullish. This calls for a potential correction in the market.
Conversely, when the bullish percent index is below 30%, the inference is that the market sentiment is overwhelmingly bearish.
Therefore, when you use the bullish percent index, you can use this market breadth indicator to time the markets.
The chart below gives an illustration of the bullish percent index in action. As mentioned earlier, this market breadth indicator is not available on all charting platforms. However, you can find this indicator on the Stockcharts.com website.
The chart below shows the price chart for the Dow Jones Industrial Average. At the bottom, is the Bullish percent index indicator.
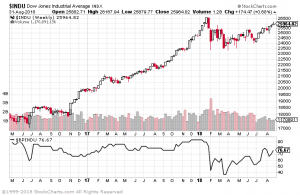
Bullish Percent Index for the Dow Jones Industrial Average. Source: Stockcharts.com
What you see in the above chart is how the BPI’s turning points coincide with the market timing. Every time the BPI falls below 30, you can see that the Dow Jones Industrial average turns to hit fresh highs.
The Bullish percent index can also be used to gauge the market sentiment for other indexes such as the S&P500. Simply use the ticker $BPSPX.
Bullish percent index and the time frame
And if you haven’t noticed already, the time frame we are using is the weekly period. Why so you may ask?
This is because the bullish percent index works well on the weekly time frame. This might put off the day traders, but at the very least, you can know when the markets are most likely to reverse. Using the information off the weekly chart, day traders can then apply their own trading strategy to be on the right side of the markets.
While one can also use the BPI on the daily time frame, it would make for a great strategy to capture the long term trend based on the weekly chart. This can then empower the trader with the trend that is validated by the BPI.
The day trader or swing trader can later employ their own trading strategy to further pick the turning points in the market.
But before we go any further, one question that might have cropped up is the point and figure chart. After all, the bullish percent index is based upon this seemingly less commonly used chart type.
What is the point and figure chart?
A point and figure chart is a unique chart type used in technical analysis. What’s unique about this chart type is that it takes into account only price. In other words, a point and figure chart is independent of time.
There are many other chart types that work in a similar fashion, for example Renko charts and Kagi charts. These chart types aim to eliminate the noise and focus purely on price action. The point and figure chart is also visually unique.
Instead of the conventional chart types that make use of candlesticks or bars or line charts, a point and figure chart makes use of X and O. The X depicts rising prices while O depicts falling prices.
You might be surprised to know that a point and figure chart is over a hundred years old. The first reference to this chart type was made in 1898, according to this article on Wikipedia. The point and figure chart tends to capture trends as it focuses only on price.
Therefore, when price is moving x points a new X is drawn on the chart. Thus, in a strong uptrend you can see a number of X’s. When price reverses, a new O is plotted. The X and O’s are plotted in a vertical line with every change in trend plotted in a new column.
Below is an example of how a point and figure chart looks like.
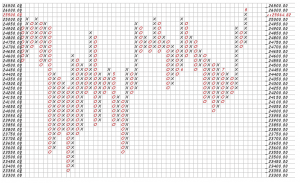
Point and Figure Chart – Dow Jones Industrial Average
How to use the Bullish percent index?
So far we have seen what a market breadth indicator is and a brief introduction to the Bullish percent indicator. The point and figure chart which forms the basis of the bullish percent indicator gives more details.
The next question that comes to mind is how to use this information in your trading.
The first step is to look at an index. It is ideal to focus on the main stock indexes such as the Dow Jones or the S&P500. Day traders or swing traders can look at the futures markets to trade these indices. After you identify what index you want to trade, the next step is to head over to stockcharts.com and pick the indicator.
Note that we use the weekly time frame so as to understand the major trend.
The chart below shows the S&P500 index chart with the Bullish percent index at the bottom. You can see the two instances when the Bullish percent index fell to the lows near 40.
The decline in the bullish percent index also coincides with the end of the correction on the S&P500 as well. Intraday or swing traders can use this information to go long on the markets.
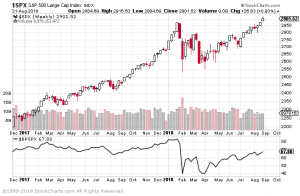
S&P500 and the Bullish percent index to time the markets
Of course, traders will need to use their own technical analysis from here on in order to confirm the uptrend. You could use indicators such as the moving average, or even the VIX volatility index in order to confirm the uptrend.
Switching to a smaller time frame chart will enable traders to fine tune their precision point to trade in the direction of the trend.
If you feel a bit more adventurous, traders can also experiment with options on the S&P500. The options will enable you to make huge profits without having to risk too much capital. But we’ll leave this for another time.
Using moving averages and the Bullish percent index
Another way to use the bullish percent index is to ride the trend itself. For this strategy, you will need to simply use the BPI and a 5-period moving average.
The next chart you see below is the Bullish percent index of the S&P500 with a 5-period moving average. What’s different in this chart is that we use the candlestick chart for the BPI.
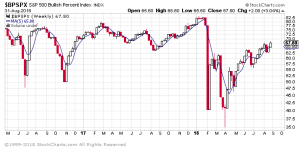
Bullish percent index with a 5-period SMA
In the above chart, you can look at the candlestick patterns and the BPI itself to time the market. For example, in the month of Aril 2018, you see that the BPI makes a steep fall to 35 before pulling back. You can see the bullish reversal pattern following the doji candlestick formed at the low.
Evidently, after a minor pullback in price action, the BPI starts to push higher. The apparent price action in the bullish percent index coincides with the market movement in the S&P500 index as well.
Confirm Bear Markets
The bullish percent index can be used to confirm bear markets. Simply count the number of O’s in the column furthest to the right and then count the most recent column of O’s on the left after a sharp move down in the market. If the number of O’s in the column on the right are greater than the number of O’s in the left column, there is a new bear market in play.
Bull Market Corrections
Sharp downward moves are commonplace in a bull market. Traders can use the bullish percent index to anticipate these types of moves. If the BPI has been above 70% for sometime, and then crosses below 70%, one can expect some sort of correction in order to bring more buyers into the market.
Bear Market Corrections
Dead cat bounces occur frequently during extended bear markets. Traders can use the bullish percent index to anticipate these types of moves. If the BPI has been below 30% for sometime, and then crosses above 30%, one can expect some sort of bounce in order to bring more sellers into the market.
BPI and Moving Averages
Some traders do not like to wait for the bullish percent index to make the two-point move on the point and figure chart in order to generate a trade signal. They feel that the lag time in generating bullish and bearish calls is to long and could generate late moves. So, some sophisticated traders will plot the BPI as a line and place a 5-MA or 10-MA on the chart. These traders will sell the market if the BPI crosses below their moving average of choice, or buy when it crosses above the respective moving average. The benefit of this is that traders can receive a trade signal well before the BPI crosses above 30% or below 70%. On the flipside, if a false signal in generated, the market could continue much further in the direction of the primary trend, thus extended the trader’s losses.

Why use the Bullish percent index?
This article so far covers what the bullish percent index is all about and how it works. Now it is time to figure out why you would want to use this indicator.
For starters, remember that the Bullish percent index is based on a unique charting method of Point and Figure. This charting type eliminates time factor and focuses only on the price action helps to remove noise in the market.
Using the signals of the bullish percent index, you are basically combining pure price action to the regular chart. As a result, the signals you get based on the BPI are rather unique.
However, we should remind you once again that the BPI is not your traditional add and trade type of indicator. The BPI merely alerts you to the trends in the market and the turning points as well.
Instead of adhering to the regular technical analysis which is prone to noise and choppiness of the markets, you can use the BPI. The BPI is the first step of your technical analysis. Following the signals you get from the BPI, the next step is to use your own preferred method of analysis.
However, what’s important is that while using your regular trading strategy, you also apply the knowledge from the BPI.
In conclusion, using the BPI will take time. However, with a bit of practice you will soon realize the edge you get with the bullish percent indicator.


