The Andrews pitchfork indicator, commonly referred to as ‘median lines,’ is one of the most versatile trading tools available.
We will explore the basics of the indicator and strategies you can use to identify support and resistance levels.
The Inspiration for the Andrews Pitchfork
Dr. Alan Andrews drew inspiration from Roger Babson for the creation of the pitchfork.
Roger developed the concept of action/reaction lines after witnessing a significant market correction in the early 1900s.
After seeing billions of dollars evaporate into thin air, Babson believed his action/reaction lines were a preventive measure for future would-be investors by providing price action for extreme support and resistance areas in the market.
Like Andrews, Babson also took inspiration from another brilliant person – Isaac Newton.
Babson’s lines were inspired by the works of Isaac Newton and the laws of gravity. Most of the pitchfork’s concepts are focused around Newton’s third law which states “For every action, there is an equal and an opposite reaction.”
If that was tough to follow, let’s quickly recap. Andrews pulled inspiration from Babson who also pulled inspiration from Newton, thus you could say Andrews pitchfork is a Newtonian trading strategy.
Why is this important to know? You need to know that while the indicator looks like something a smart fourth grader could have created, a lot of thought has been given to the indicator.
Overview – Andrews Pitchfork
Shifting back to Andrews pitchfork, the indicator is a median line with an upper and a lower parallel line.
The chart below illustrates a sample median line or Andrews pitchfork applied to a stock chart.
Andrews Pitchfork tool
Time Frames and Markets
The Andrews pitchfork works in any time frame. This, of course, can range from tick charts to monthly. This allows the indicator to work well for day trading and long-term investing.
The indicator can also work on any security. So, whether you like to trade cryptocurrencies, futures, or stocks, the pitchfork has you covered.
Plotting the Andrews Pitchfork Tool Correctly
Traders need to identify the right points as the success or failure of interpreting signals depends largely on how one plots the median lines.
In most cases, drawing the median lines is rather subjective, but with practice, one can develop the confidence required. A rather simple method is after pivot points are identified, tweak the median lines to encapsulate price action with the greatest level of accuracy.
Trading strategies with Andrews Pitchfork Tool
There are many different trading strategies that can be built using the Andrews pitchfork tool.
According to Alan H. Andrews, there is a high probability of the following:
- Price will reach the latest median line
- Price will either reverse on reaching the median line or gap through it
- When prices pass through the median line, more often than not, prices pull back to the median line
- When price reverses before reaching the median line, it is likely that price will move in the opposite direction
- Prices will reverse at any median line
One of the major factors that work in favor of median lines or the pitchfork tool is that various studies have shown and proven the fact there is an 80% chance for any of the above Andrews’ rules to be fulfilled.
Is any of this making sense?
Well, let’s talk through four simple ways you can trade with the tool combining the above rules.
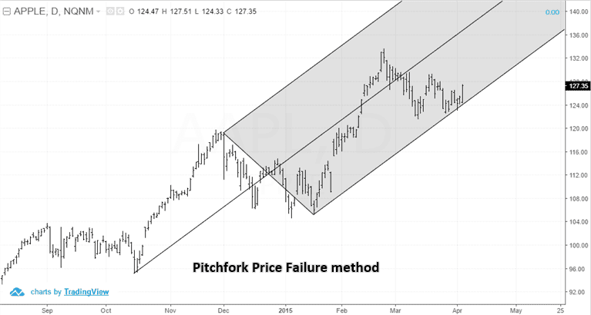
1. The Price Failure Rule
One technique of Alan Andrews’ is the price failure rule which often catches the larger trading community by surprise.
The price failure rule was well documented and explained by Gordon DeRoos, in his book, “Trading With The Pitchfork”.
If you follow this link you can see both the book and trading coursework which goes into excruciating detail.
The price failure rule forces the trader to look at what prices are not doing, rather than following the herd.
It is widely known that prices gravitate to the median line 80% of the time. Once at the median line, there are two possibilities – price will either gap through the median line or reverse course.
With the price failure rule, traders focus on the factor of when price fails to reach the median line.
A trader waits for the price to reverse near the median line and waits for the strong counter move.
Real-Life Long Example
The chart below illustrates the price failure rule with the QQQ PowerShares ETF. Here, you can see a falling pitchfork encapsulates the downtrend nicely. In this scenario, conventional wisdom states to look for a short position.
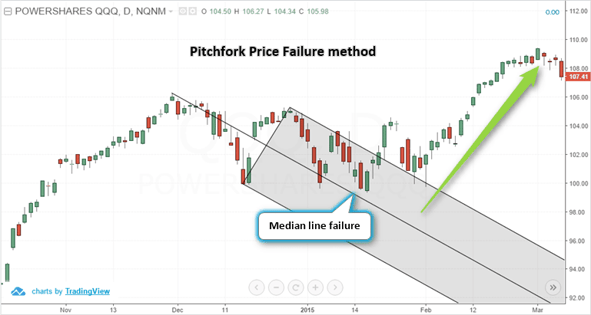
Pitchfork – Price failure method
However, notice how price bounces back and forth between the median line and the outer median line. The final bounce off the upper median line shows prices failing to reach the median line. This eventually leads to a price reversal higher.
For traders, this would have been a surprise on the sudden change in direction in the markets and lead to a short squeeze once the daily highs were exceeded.
2. The Mini-Median Line Method
The mini-median line method involves drawing two opposing median lines. As the name suggests, the mini-median line is smaller in scope and signals a counter move to the primary pitchfork tool.
Another unique aspect of the mini-median line methods is that closing prices are used instead of the high or low prices.
Once a counter or opposing median line is plotted over 5 to 10 bars, the mini-median line can be used as a trade trigger. Alongside the mini-median line tool, we also need to plot a sliding parallel line.
Real-life Long Trade Example
The overall slope of the primary pitchfork suggests prices will continue to push higher.
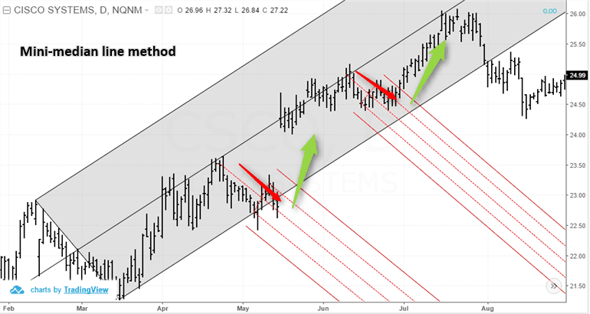
Mini-median line trading method
As you can see, there are two mini-median lines on the chart. Once the price breaks the first mini-median line, the stock gaps higher up to the median of the primary pitchfork.
The stock then pulls back and forms another mini-median line. Once this line is broken, the stock runs 5% up to the primary pitchfork median line.
These are just two examples of how you can use trends within a trend to identify buying opportunities.
3. The Flat Price Action Method
In the flat price action method, the trader needs to look for price to stall near the median line.
This method is usually indicative that prices are likely to change direction and is a cousin of the price failure method. The one difference is the price failure method does not require consolidation before taking a position.
For the flat price action method, prices need to move in a strong rally first, typically from the third pivot point. The fewer pullbacks in this leg of the formation, the better.
Once price hits the median line, look for consolidation near the median line.
Typically price breaks to the downside and posts a strong correction back to the third pivot point.
Short Trade Example
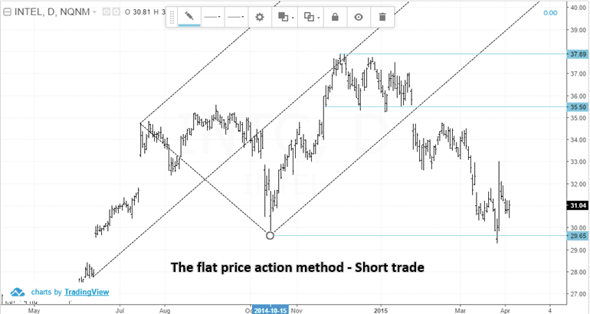
Flat price action method (Short trade example)
Here, you can see the strong move from the pivot low and prices failing to break the median line convincingly. This develops into a consolidation range between 37.89 and 35.50. The break down from 35.50 sends prices back to the third pivot point at 29.65.
Long Trade Example
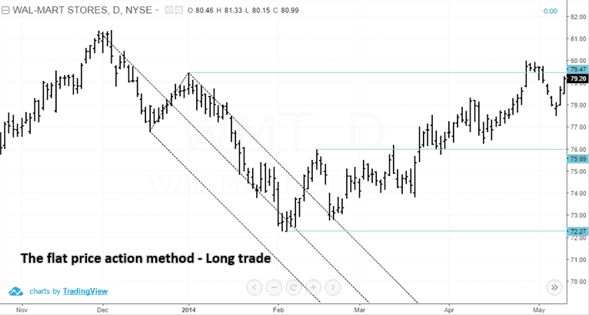
Flat price action method (Long trade example)
In this example, prices post a steady decline from the third pivot point high. We then get some consolidation between 75.99 and 72.27.
The upside breakout from this range sends prices higher with a target of the third pivot point high at 79.47.
Day Trading with this Approach
Day trading with this approach will prove challenging. This is because consolidation often takes place in the middle of the day, where the market slows down.
Therefore, if you are going to day trade this pattern, you need to begin looking for setups in the early afternoon around 2 pm for late day breakouts.
4. Andrews Pitchfork Tool and Divergence
Another way to trade the Andrews pitchfork tool is to look for divergences between the pitchfork and another indicator or price.
Divergence between the Pitchfork and Relative Strength Indicator
In this first example, you can see how the bearish divergence was formed with price making a higher high while the relative strength index was seen making a lower high. Following this high that stalled near 16.60, price eventually broke down through the lower median line following the price failure.
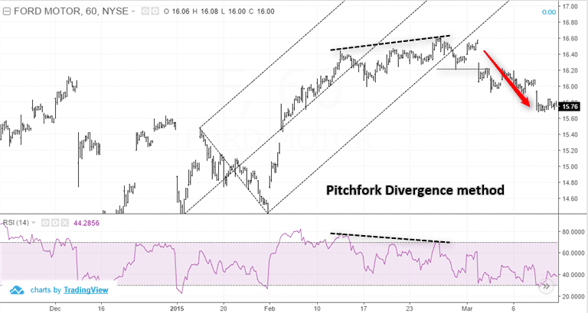
Pitchfork divergence method – Short position
In the next chart, you can see that while prices posted a lower low, the 13 period RSI signaled a higher high, which indicated a bullish divergence in price. The fact that prices stalled near the median line indicated that price would be reversing upward shortly.
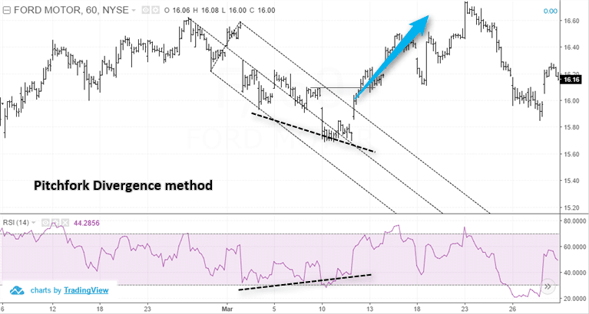
Pitchfork divergence method – Long position
Following the breakout from the outer median line, we can see that the long position resulted in a profit as price continued to push higher.
Besides the RSI, other oscillators that can be used include the MACD and stochastics.
Elliott Waves and Andrews Pitchfork
In many cases, the concepts of Elliott wave can be applied to the median line itself. Not many traders have fully grasped this method, but when combined, median lines and Elliott wave can be a great way to trade the market with confidence.
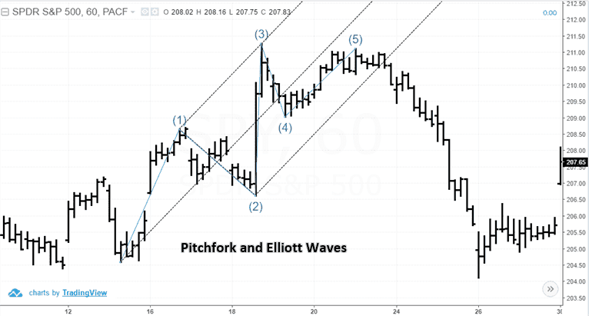
Andrews’ Pitchfork tool and Elliott Waves
The above chart gives a brief illustration of Elliott wave counts that coincide with the Andrews’ pitchfork tool.
As you can see the Elliott wave counts fit nicely within the pitchfork. For example, if you have a wave five failure that barely ticks over the third wave high and also fails at the median line, you can use this as validation of the wave pattern.
Summary
Like any other indicator, the pitchfork is not perfect. You will need to have solid money management techniques in place before placing any live trades.
The key is to have a set of rules you follow and to remember to keep your stops.


 Chart Patterns


