Three Explosive Anchored VWAP Strategies + Explanation Video
Sep 3, 2021
Written by: John McDowell
✓ Reviewed by Al Hill, Co-Founder of TradingSim · Updated Mar 31, 2026
Most anchored vwap strategies are centered around swing trading. However, the strategies used on daily charts can also become major support or resistance for day traders.
In this post, we’ll show you how to develop your edge with three anchored vwap strategies and explain the theory behind the indicator. But before we do, take a moment to watch the video below on how to apply this indicator to your trading tool belt.
VWAP vs. Anchored VWAP
What’s the difference between the two?
VWAP
For starters, you need some understanding of what vwap is. It stands for the volume weighted average price. As a lagging indicator, it tells you where the majority of buys and sells for any given ticker have occurred on average as price evolves throughout the day.
As an example, imagine a stock that runs from $2-$5 and then regresses to $2 by the end of the day. If the majority of the volume came at the highs, then your vwap indicator will likely remain high on the day’s close. Whereas, a simple moving average will fluctuate more as it is based only on the price.
For a deep dive on vwap, be sure to check out our ultimate guide on the subject.
Anchored VWAP
How the two differ involves the anchor. VWAP is a moving indicator used intraday – starting with the first bar and ending with the last of the day. Anchored vwap, on the other hand, is tethered to a specific bar and displays the cumulative struggle of bulls and bears from that bar.
Developed by Brian Shannon, CMT, the anchored vwap (similar to traditional vwap) is more of a trend indicator. Shannon discovered the idea that certain days on a chart were more important than others. By anchoring vwap to a specific day, it could reveal the longer term support or resistance of bulls or bears who may have initiated positions either on that day or near the avwap later on.
These events could be anything from earnings to news releases, or simply high volume days on the chart. Similar to a pivot point or vwap boulevard in that it is often a firm psychological resistance level in the market, it differs in that it isn’t as static. Anchored vwap, while it sounds stationary, evolves as price and volume change. The fixture is simply the starting point of the calculation.
What Does Anchored VWAP tell us?
Much like volume at price, anchored vwap can tell us the price at which most traders are commonly positioned. Let’s use a visual example to explain this:
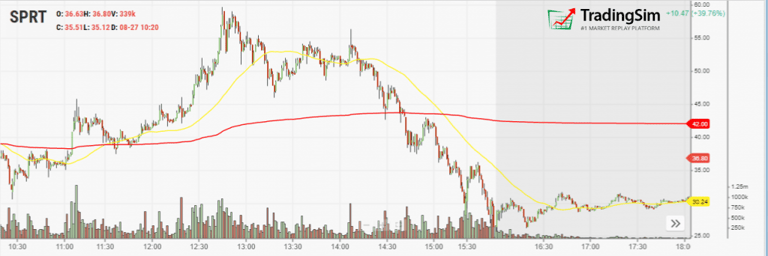
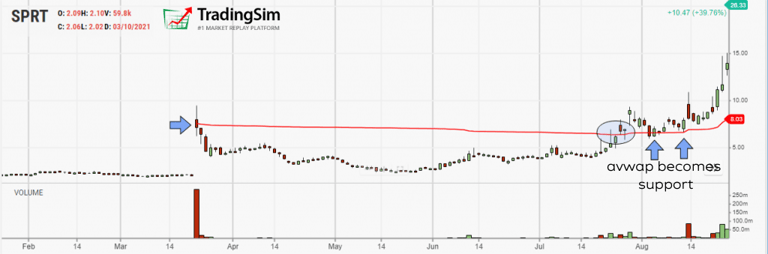
Anchored VWAP for SPRT
In this example, we anchored vwap to the largest prior volume day on the chart. Volume is significant, and whatever catalyst caused this move is inconsequential. The important thing is the volume traded on the day.
When we anchor vwap to this day, months down the road it becomes significant again. SPRT had a very high short interest — above 60%. This is significant, especially if any institutions were shorting the stock on the large volume day in March. As the months went by, we see that there are few opportunities for all of those shares to be covered.
In other words, liquidity dried up. That is, until July and August came around and demand for the stock began to push it higher.
As price reached the prior anchored volume weighted average price, we begin to see a lot of turmoil in the price at this level. Resistance first, then support, and support again – shown by the arrows.
The Significance of Anchored VWAP
The significance here is the underlying revelation of who is underwater and who is comfortable. Shorts had the upper hand for months, but once the price of the stock began to climb back to their “average” price, it became clear that shorts were in trouble. Millions of shares aren’t covered easily when a stock float is as small as 15 million, like SPRT.
This begins the game of averaging up to salvage the position. But with every effort to re-average, the pot of water gets hotter. And if the demand doesn’t let up, the end result can be catastrophic as margin calls pour in and brokers start cutting their losses by covering their client’s position. For more information on this, see our post on float rotation.
This can work in favor of shorts as well. If buyers and bag holders are averaged above the current avwap levels, it is likely the key average might provide resistance on any rallies into it. Will discuss this in an example below.
Three Anchored VWAP Strategies with Real Examples
Let’s take a look at three specific strategies you can use with the anchored VWAP indicator.
1. Red to Green Moves
This is a very simple strategy like the example we used above with SPRT. The strategy revolves around a move from being below the avwap to being above it. In other words, what was once resistance has become support, or longs who were red, are now green.
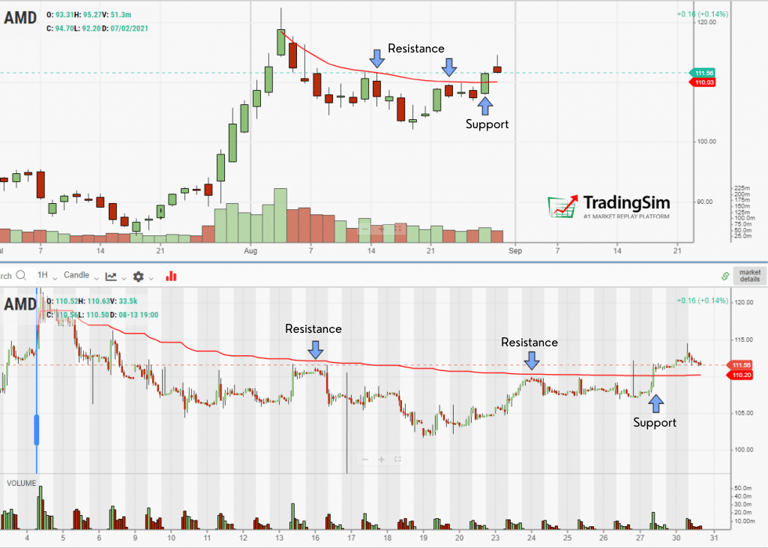
Let’s look at a recent example with AMD. Notice how AMD had a huge run up and then stalled. First, we anchored the vwap to the all-time high candle. Then, we allow time for the stock to pullback and consolidate. Here is what this looks like on a daily and hourly chart.
AMD red/green anchored vwap strategy
Notice that the avwap resisted the price for a number of days until the last two days. The astute trader could have kept this on radar, watching the consolidation, waiting to buy the “red to green” breakout at avwap.
The volume picked up on the break through this avwap level. Much like we saw with SPRT above, the importance of this level is on display as buyers step in and shorts realize they need to cover in case their average diminishes with any further price movement upward.
Other Signals to Consider
As with any strategy and indicator, the more favorable signals you can find, the better. In the example above, you also have a reverse head and shoulders pattern forming, along with a nice Volatility Contraction Pattern and a Pocket Pivot as well.
We won’t go into those in detail here, but rest assured you can find any number of other signals like moving averages or patterns to help confirm your avwap strategies.
2. Green to Red Moves
The great thing about vwap is that it typically becomes the precipice of a move in either direction. To that end, you can play avwap to the short side once a support is broken. Hence, the longs that were once green are now in the red.
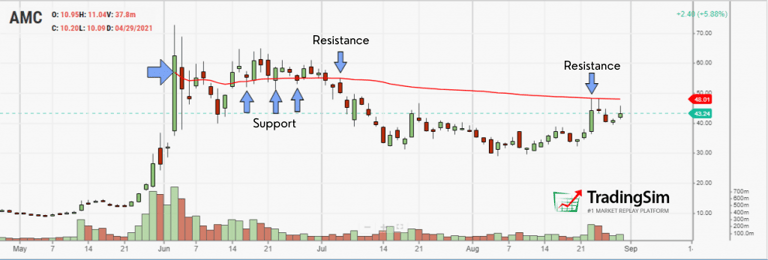
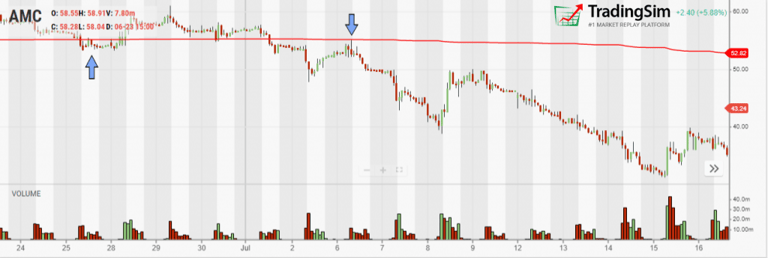
AMC is a hot momentum stock catching a lot of popularity lately. It provided such an opportunity to go short as YOLOers and HODLers piled in as it ripped to new highs. Later it failed at the anchored vwap. Here is the chart:
AMC Green to Red avwap strategy
As you study the chart, pay close attention to the story it is telling you. From where we anchored vwap at the highest volume and price candle bar, a lot of retail buying is occurring here as shares are being sold by those who’ve been holding from a much lower price.
Shares are being dumped, but are also being bought. The result is a tug of war in the ensuing weeks. As you can see, avwap tried to defend, but bears eventually won.
The avwap gives us the backdrop for the story between the bulls and the bears.
Intraday Trades
Over the course of the next few weeks, we see that this anchored VWAP level provided some support but was eventually overcome by too much supply at these high prices.
Interposing this important line on your intraday chart could have alerted you to a perfect shorting opportunity as AMC retested the underside of the avwap line on July 6 denoted by the blue downward pointing arrow.
AMC 1 Hour Chart
Looks pretty clean, eh? We think so, too.
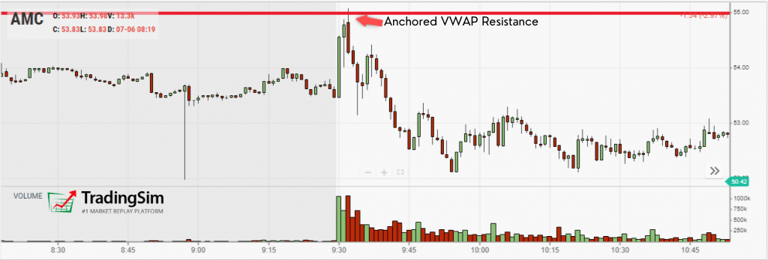
Now look at the one minute chart at this level. A bit uncanny how accurate it can be.
Anchored vwap resistance
Like taking kid from a candy, the stock tried to rally into this red anchored VWAP level, but couldn’t survive the supply.
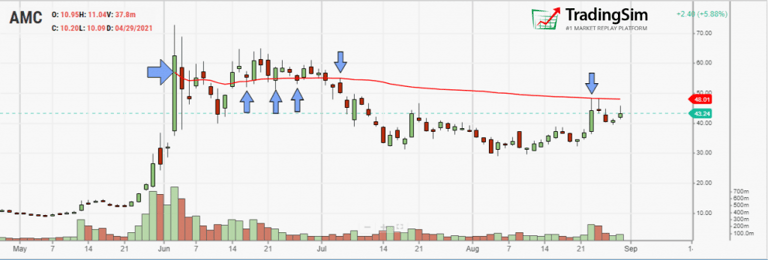
Later on in August, as the consolidation continued and matured, a rally brought the price of the stock back to this avwap level. Let’s look at it one more time to see what happened:
AMC Green to Red avwap strategy
One of two strategies could have been employed here. If you were long for the rally, it provided a perfect profit target. If you’re short biased, it provided yet another opportunity for an intraday short.
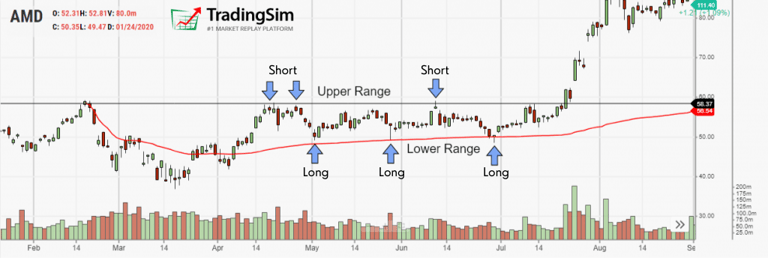
3. Range Based Trades Using Anchored VWAP
Range trading can provide fantastic opportunities for short term trades. Often, trading ranges can be easily denoted by a quick glance at a chart identifying support and resistance. But with avwap, you’ve got an extra layer of confirmation to add to your trades.
In the example below, we’ve tethered vwap to the prior high made before the trading range began. This gives us a nice base for the range as it consolidates for the next move. Then with the formation of our first retest of those highs at the blue downward arrows, we can anticipate the upper bounds of the range by drawing a line.
Here’s what it looks like:
AMD anchored VWAP trading range strategy
As you can see, this would’ve generated multiple trade signals as price bounced between the highs and lows of the range. Each level provided support or resistance for a number of weeks.
It is within these predictable patterns that short term swing trades and day trades can rack up significant profits before breakouts occur.
How to Practice With the AVWAP
Practice is the key to success in the markets. It isn’t worth putting your hard-earned money to risk in the markets until you’ve mastered a pattern.
One of the best ways to practice with avwap is to throw it on your charts and move the “anchor” around and see what happens. Where does it support? Where does it break? Can multiple avwaps on a chart give bigger clues to where long term money is located?
Like Brian Shannon, we recommend taking the indicator and tagging it to the significant areas of the chart like highs, lows, big volume days, events, etc.
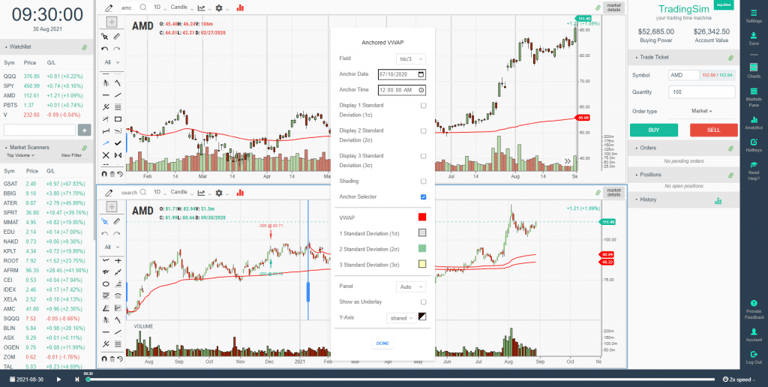
When practicing in the simulator, you can find anchored VWAP in the studies tab. It will pop up a settings window that will allow you to enable other features like standard deviations, anchor selector, color, and more.
Anchored VWAP Indicator
As with any indicator, the default settings are usually the most popular, but it never hurts to play with it to get a feel.
Conclusion
We hope you’ve found this helpful. Be sure to give these strategies a go in the simulator and let us know how successful you find them to be!
John McDowell is the Lead Content Strategist at TradingSim. His journey into day trading began in 2016 after conversations with a retired hedge fund manager. John is passionate about teaching and educating traders, curating content that helps others succeed in the stock market.
The Kill Candle. It just sounds menacing, doesn’t it? And for good reason. If you’ve ever been caught in one on the long side, you understand the pain. What Is A Kill Candle? Day trading legend Bao...
The word capitulate means to give up or stop trying. It’s easy to see how this would apply to trading, especially considering the current market environment of 2022. In times of market volatility and...
7 Swing Trading Strategies That Actually Work [2026 Guide]
Swing trades held for 2-10 days captured 68% of the S&P 500's total return over the last decade, according to analysis from J.P. Morgan's equity derivatives team. That's the entire return. Every bit...


 Day Trading


