If you are a fan of trading with moving averages and unfamiliar with the alligator indicator, get ready for a pleasant surprise. In this article, we are going to do a head-to-head comparison of the Alligator indicator with the triple EMA (TEMA) to see which one comes out on top.
What is the Alligator indicator?
The Alligator indicator is an on-chart trading tool created by famous trader and author Bill Williams.
The Alligator is used to confirm ongoing trends and their primary direction. In addition to identifying existing trends, seasoned traders also use the alligator indicator to enter counter-trend moves.
The Alligator consists of three moving averages. Note these moving averages are not just SMAs or EMAs; the secret behind the Alligator is a bit more complex. Thus, keep reading!
What is behind the Alligator?
The Alligator indicator has three lines – green, red, and blue. The green line tracks closest to the price action, the red line is the middle average and the blue line is the furthest from the price action.
Look at the below image for a working example:
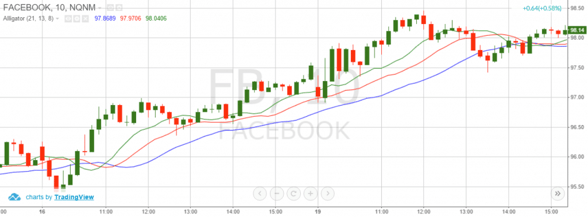
Alligator Indicator
Composition of Three Lines
- Green – this is line represents the Alligator’s lips. It is a 5-period smoothed moving average, displaced 3 periods to the right.
- Red – this line represents the Alligator’s teeth. It is an 8-period smoothed moving average, displaced 5 periods to the right.
- Blue – this line represents the Alligator’s jaws. It is a 13-period smoothed moving average, displaced 8 periods to the right.
The above is the default Bill Williams Alligator settings, which of course can be configured to meet any trading style.

What signals are provided by the Alligator?
The Bill Williams Alligator has three stages:
The Alligator is sleeping
The signs of a sleeping Alligator are when the three lines are close to each other. This of course translates to low volatility and trading should be avoided during these lull periods.
The Alligator is waking up
Usually, this is the time when the lips of the Alligator (green line) cross the teeth (red line) and the jaws (blue line). If the lips cross the other two lines in an upwards fashion, we have an awakening bullish Alligator. If the lips cross the other lines in a downward fashion, we have an awakening bearish Alligator.
The Alligator is eating
This is when we should also be eating – not burgers, but profits!
The Alligator could start eating after waking up. The signal for a hungry Alligator is after the completion of the waking-up stage, a candle closes below or above the three lines. This is when we should go long or short respectively.
The image below illustrates the three stages of the Alligator:
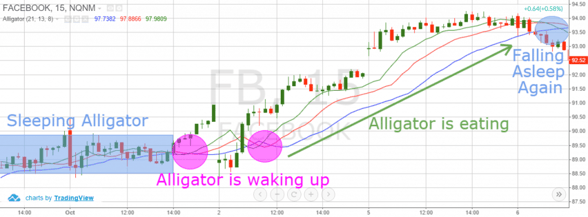
Alligator Stages
This is a 15-minute chart of Facebook from Oct 1-6, 2015.
In the blue rectangle, the Alligator is sleeping and we should not open any positions.
The pink circles show us when the Alligator is attempting to wake up. In these moments, we should prepare ourselves for a long position.
When the distance between the lines begins to expand and we see a bullish candle closing above the Alligator teeth and jaws, we go long.
Now that we have covered the Alligator indicator, let’s take a look at the TEMA.
What is the Triple EMA (TEMA)?
The triple exponential moving average, also known as the TEMA, is a single line configuration on the chart. It smoothes the price of the equity three times using an EMA formula and then calculates the change in the EMAs based on the result for the previous day (n-1). Traders use the TEMA to enter and manage trades during strong trending markets. Conversely, the TEMA is not a great tool when the market is ranging, since it provides many fake signals.

What forms the TEMA?
The TEMA line can easily be mistaken for one of the many moving average indicators. Don’t believe me, check out the below image:
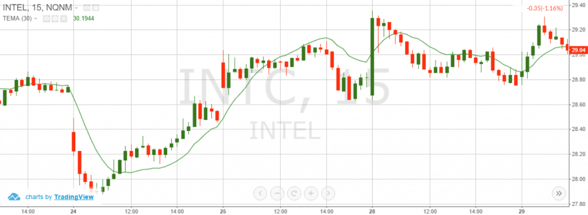
Triple Exponential Moving Average
You may be thinking: “Hey, isn’t this a 10 or 15-period SMA?” Wrong!
This is a 15-minute chart of Intel from Sep 24-29, 2015. As you can see, the TEMA bounces above and beneath the price action. The thing that may not be apparent on the chart is the TEMA reduces lag usually created by the other moving averages.
Clear as mud right? I hope the next image will help clarify things a bit.
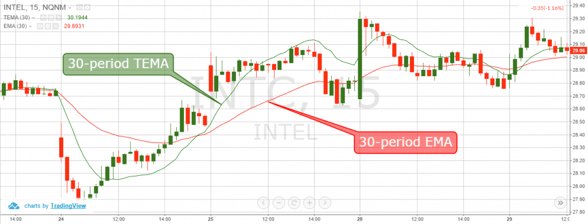
30-Period TEMA
I have added a 30-period EMA in addition to the 30-period TEMA.
Notice that the lag of the TEMA is significantly less when compared to that of the standard EMA. The reason for this can be found within the formula of the TEMA.
TEMA Formula
TEMA = (3 * EMA – 3 * EMA (EMA)) + EMA (EMA (EMA))
In life, more complexity does not always lead to better results, but in the case of the TEMA versus the EMA, this may be the outlier.
Smoothing of the TEMA Indicator
The larger the period of the TEMA, the more smoothing.
This of course also leads to further lagging in the trading signals. Thus, be careful when configuring the TEMA as the volatility and the time frame should also be taken into consideration. The tighter your TEMA, the more fake signals you will encounter on the chart.
How to trade with the TEMA?
In terms of signals, the TEMA acts the same way as a standard moving average. When the price breaks the TEMA upwards, a long signal is generated. When the price breaks the TEMA in a bearish direction, a short signal is generated.
In addition, the TEMA can be combined with an extra moving average in order to validate signals.
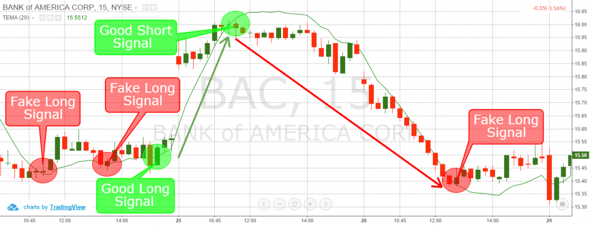
TEMA Trading Signals
Above is a 15-minutes chart of Bank of America from Sep 26-29, 2015. Here I used a 20-period TEMA configuration.
Below are the trade signals generated with the TEMA:
- 5 entry signals – four long and one short
- 3 fake signals – all of them long
- 2 winning signals – one long and one short
- Profit from winning positions = $1.02 per share
- Losses = $0.09 (9 cents) per share
- Result = profit of $0.97 per share
This is the time you should remember when I said that the TEMA strives to identify rapid market movements, but at the same time fails during ranging markets.
Thus, the TEMA setup should be carefully chosen according to market volatility, the chart range, and the trader’s style.
Alligator vs. TEMA
Now that we have covered both indicators, let’s compare the two:
- The Alligator indicator displays three lines, while the TEMA has only one line. Thus, the Alligator provides more trading signals than the TEMA.
- Since the Alligator has more components than the TEMA it is better suited as a standalone indicator.
- The Alligator indicator trading system is likely to give you less fake signals compared to the TEMA. The reason for this is when a stock is range bound; the Alligator is sleeping, which clearly says, “STAY AWAY”. At the same time, the TEMA does not give us a signal when the market is ranging, because it is a single line configuration.
- The Alligator lags more than the TEMA. As previously stated, the TEMA’s purpose is to isolate the lagging as much as possible. Thus, TEMA gives earlier entry signals than the Alligator. This makes the TEMA riskier than the Alligator, since it increases the amount of false signals. Yet, if used carefully, the TEMA could result in catching the beginning phases of a new trend.
- The TEMA gives lower number of winning signals, but these signals lead to positions with higher gains per share. The Alligator gives higher number of successful signals, but these signals will often put us in positions, which catch less than half of the trend.
Let’s now play a regular trading scenario with the Alligator and the TEMA separately in order to compare the results:
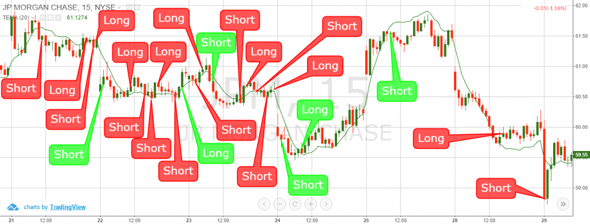
Too Many TEMA Trading Signals
Wow! What chaos! The truth is that this is what you are going to get when trading with the TEMA.
This is a 15-minutes chart of JP Morgan & Chase for the period of Sep 21-29, 2015. We applied a 20-period TEMA to the chart and we get the following results:
- 24 entry signals – 14 short and 10 long
- 18 fake signals – 10 short and 8 long
- 6 good signals – 4 short and 2 long
- Profit from winning positions = $4.47 per share
- Losses = $3.35 per share
- Result = profit of $1.12 per share
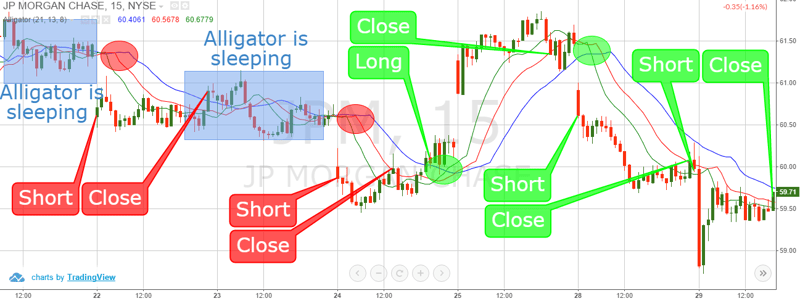
Now we are going to use the same chart, but will only apply the Alligator indicator:

Alligator Trading Signals
Much clearer than the previous example, don’t you think? Let’s now summarize the information from this picture:
- 5 entry signals – 4 short and 1 long
- 2 fake signals – both are short
- 3 good signals – 2 short and 1 long
- Profit from winning positions = $2.02 per share
- Losses = $0.45 (45 cents) per share
- Result = profit of $1.57 per share
The Alligator or the TEMA, that is the question!
I believe the results speak for themselves.
| |
Alligator |
TEMA |
| Signals (Positions) |
5 |
24 |
| Fake Signals |
2 |
18 |
| Winning Positions |
3 |
6 |
| Total Profit |
$1.57 per share |
$1.12 per share |
With the Alligator, we have achieved better results with 20% of the effort. What we did not show in the above example are the commission savings you would have racked up by using the Alligator indicator.
Of course, one trading example is not enough data to declare victory; however, reducing the noise, less commissions and the fact the Alligator can stand on its own is more than enough reasons to rank it above the TEMA.
In Conclusion:
- The Alligator indicator consists of three moving averages – the lips, the teeth and the jaws of the Alligator.
- The Alligator gives three signals:
- Sleeping Alligator – this is when we shouldn’t be in the market
- Awakening Alligator – this is when we should get ready to hop in the market
- Eating Alligator – this is when we should be in the market
- The TEMA shows a single curved line, which is formed by a triple smoothed exponential moving average formula.
- The purpose of the TEMA is to hop into emerging trends and reducing the lag of trading signals.
- The TEMA gives us two signals:
- Go long when the price closes above the TEMA.
- Go short when the price closes beneath the TEMA.
- The TEMA generates many fake signals, because it consists of only one line. Again, the TEMA is more sensitive to the movement of the price compared to other MAs.
- The TEMA gives more fake signals than the Alligator.
- The Alligator produces less trading signals.
- The Alligator gives better results as a single on chart tool.


 Day Trading Indicators


