Advance/Decline Index – Market Breadth Indicator
The Advance – Decline Index Line or AD Line is an indicator used in the technical analysis of the stock markets. The Advance – Decline Index line belongs to the family of market breadth indicators which are used to measure the market volatility by focusing on how the stocks at an exchange are behaving.
The Advance – Decline line measures the net stock advances which are derived from the number of advancing stocks less the number of declining stocks. Needless to say, net advances rise when there are more advancing stocks and the net declines are high when there are more declining stocks.
This signals when the overall market sentiment is bullish or bearish.
Combining the above information, the Advance Decline line is a cumulative measure of the net advances or declines. The Advance Decline line is based on the theory which uses the number of advancing or declining stocks to determine whether one should buy or sell a security.
The advance decline index line should not be confused with the Advance Decline ratio or ADR which works on the similar principle but is calculated differently. The AD line is widely used in the calculation of other indicators such as the ARMS Index or even the AD ratio indicator.
The chart below shows the Advance decline line (AD line) applied to the daily chart of the SPDR S&P500 SPY ETF.
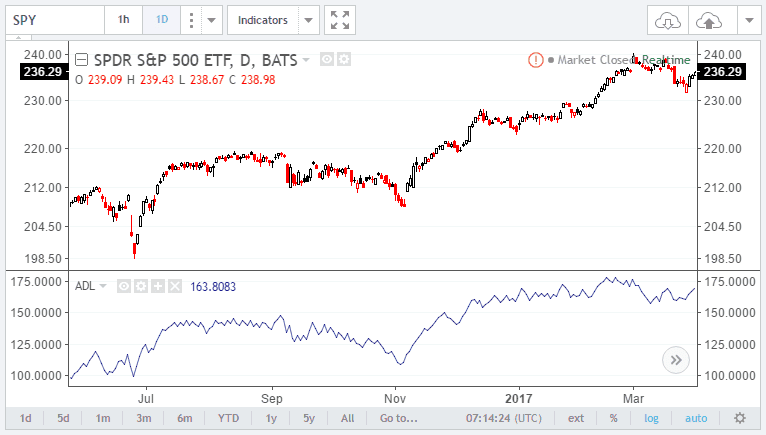
SPY ETF and the Advance Decline Line
1 – How is the Advance – Decline Index Line calculated?
The calculation of the advance and decline index line is very simple.
The AD line is calculated as follows:
The Advance Decline index line takes the values from the stock exchange’s number of advancing and declining issues. The information is available on a daily basis and the indicator is usually standard when it comes to stocks. There are also ready-made ticker symbols that can be used to manually calculate the Advance/Decline index.
The next chart below shows how the AD Line uses the NYSE Advance minus decline index (NYSE: ADD). The advance decline line smoothes the information to show the AD Line that gradually rises and falls, as compared to the day to day fluctuations in the NYSE ADD index in this example.
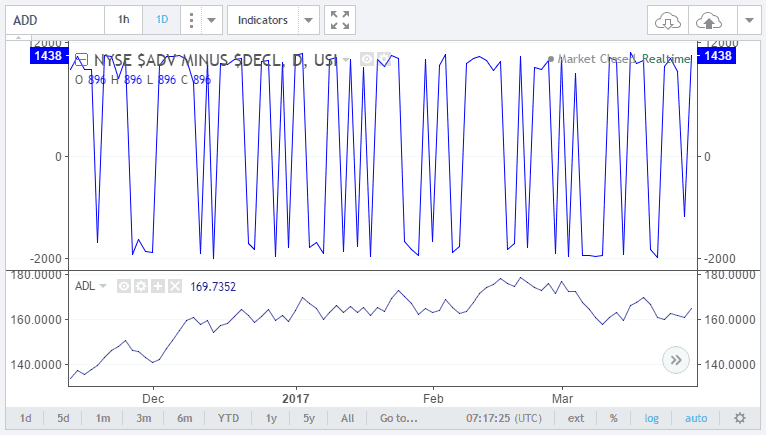
AD Line, based off the Advance – Decline Indicator
The Advance decline line can be calculated for the NYSE and the NASDAQ stocks separately. There are also AD-line indicators for the S&P500 index as well.
Traders can also build their own AD line for a select set of stocks such as monitoring the stocks in their portfolio and then use the rather simplistic calculation to build the Advance/Decline index. This method can be applied to stocks in a particular sector or other custom stocks.
2 – How to interpret the Advance Decline line?
The Advance Decline index line shows the level of participation in the overall advance or decline of the stocks. When the AD line starts to rise and more importantly posts an extreme high, it signals that the overall participation in the stocks is bullish and signals a continuation in the advancing stocks.
On the other hand, when the advance decline line starts to post a new extreme low it signals that the overall participation is bearish.
Based on the AD line, traders can time their entry into the trade by determining the trends. Typically it is not recommended to buy when the AD line is falling. However, market bottoms often coincide when the AD line starts to post a bottom and begins to rise.
By comparing the level of participation, traders can also potentially identify false market signals. For example, if you notice that a stock was making a new high but the Advance Decline index line was not confirming the market participation it can be a sign that the stock is likely to correct from the highs.
This is also referred to as divergence to price and can be a great way to use the Advance decline index line as a means to confirm or validate trading signals.
Traders should note that using the advance decline index line on its own does not offer much value as other factors such as the fundamentals, the trend of the security needs to be taken into consideration as well.
3 – How can you use the Advance Decline index line?
The Advance decline index line can be used in many different ways, but here are three common uses of this indicator.
- The AD line is used as a confirming indication to validate the strength of the trend and also to ascertain the possibility of a reversal or a trend correction
- The AD line can be used to confirm market tops based on increasing or decreasing market participation. When stocks posts a high but the AD line is not confirming this high (market participation), it signals that the highs in the security are coming off from just a few market participation and therefore increases the likelihood of a correction from the top
- Technical traders will find that the AD line can be used as an indicator to confirm support or resistance levels.
Let’s take a look at each of these methods in more detail when analyzing stocks.
1. How to use the AD line to confirm trend strength?
The Advance/Decline index can be used in conjunction with trend indicators such as the moving averages, or even Bollinger bands. Here, the AD line can be used to confirm the dips in prices. For example, when a security is trading near the 50-period EMA, the AD line can be used to check if there will be a reversal in price.
This usually occurs when the AD line is near the lows and starts to rise higher and this coincides with a local low in price.
The Advance Decline line chart below shows how price dips below the 50-period EMA and posts a bottom. This coincides with the AD line posting an extreme low, signaling that a reversal was about to take place. This is validated after price breaks higher from the previous local pivot high.
Without the AD line indicator, the price action would have signaled a continued bearish trend in price, or at the very least signaled a reversal only after a significant move in price of the security.
Finding market turning points using the AD Line
Besides using the AD line indicator as a tool to time the reversals or corrections in the trend and determining the strength of the trends, divergence can also be used. More importantly, the concept of reverse or hidden divergence can be applied to the security as well using the AD line.
The chart below shows a reverse divergence concept in play. Here, while the Cisco chart (NYSE: CSCO) posts a lower low, the Advance/Decline index posts a higher low, signaling a reverse bullish divergence.
Following the break out from the interim pivot high, the security’s price breaks out higher and continues to post fresh highs.
This method can be further validated by making use of volume analysis or other technical indicator as well.
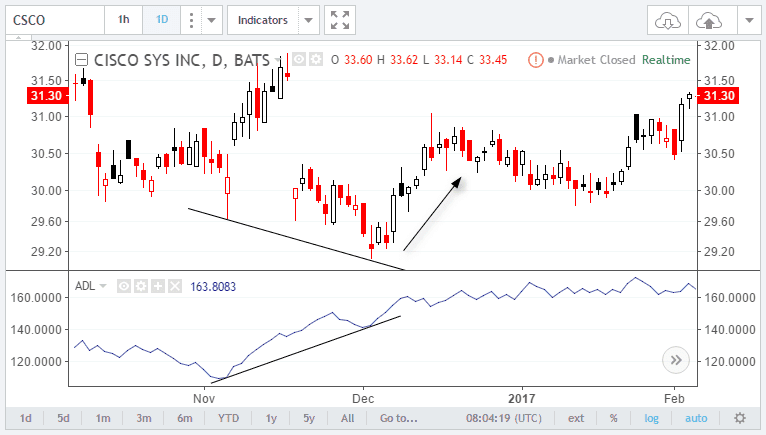
AD Line index reverse divergence
2. How to use the AD line to confirm market tops?
In this next example, the advance decline line can be used an indicator to identify potentially fake spikes in the security. The indicator is a good way to measure market tops and can alert a trader from taking a weak long position near the top.
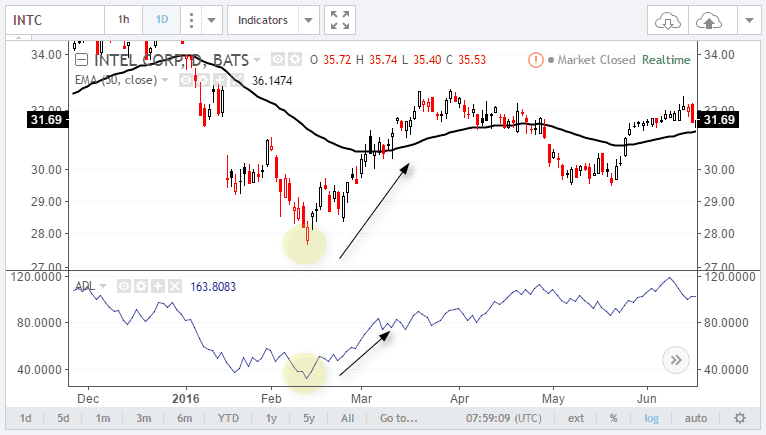
The chart below gives an example of the stock chart for Intel Corp. (NYSE: INTC). Here you can see that while the security continued to post a steady gain from around 34.00 all the way to the top at 38.00, the AD line did not confirm the market participation.
This meant that the stock as rising on falling market participation and hinted ahead of time to the trader that the security was at risk of a correction.
Evidently, after the top was posted around $38.00 in the security, price started to fall sharply, nearly by $4 and back to $34.00
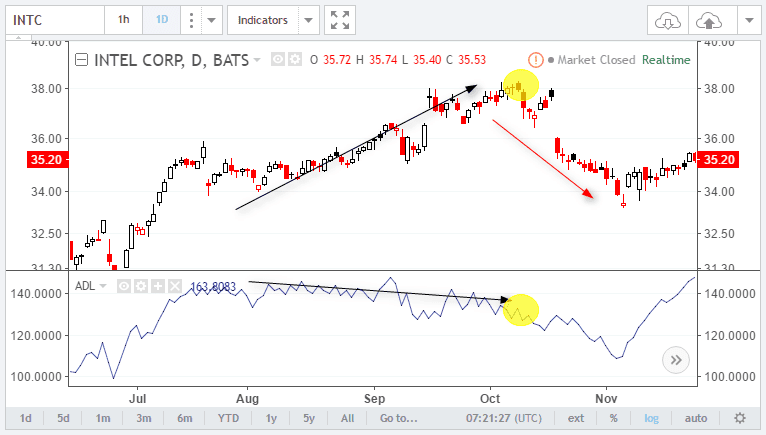
AD Line to spot market tops
Although there are other indicators can give the same technical information, the AD line is rather simple and easy to understand and the advance decline line is bound to keep the trader away from buying at the top, which is interestingly one of the most common reasons why retail investors or traders end up losing money.
The above same concept is also referred to as divergence in the markets. This occurs when the indicator fails to confirm the highs or lows in price.
3. Using the AD line index to identify support/resistance
For traders who find it difficult to spot support and resistance levels on the chart, the AD line index is a great way to understand and spot these key price levels.
The chart below shows how the turning points in the AD line index are used to validate the highs or lows in the price of the security. Following this, plotting a horizontal line, one can look at how future price action interacts with these levels.
By looking at the value of the AD line index relative to the support or resistance level, a trader an understand when there is an increase in the stock participation and thus signal a reversal from a support level.
Conversely, traders can look at previous resistance levels or support levels and compare whether the AD line index is signaling decreased participation. This could potentially signal a reversal in price of the security.
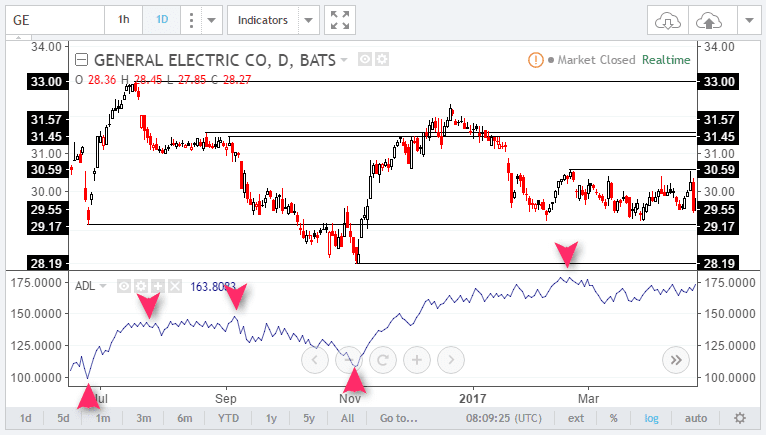
AD Line index to identify support and resistance level
Traders can also simply discard the AD line index after the support and resistance levels are identified and then switch back to their preferred trading system to trade based off these price levels.
As illustrated above, the AD line index can be used in a number of ways to analyze the price of a security and trade based off the signals accordingly.
To summarize, the advance decline line index can be used to:
- Measure market breadth by comparing the advancing and declining issues based off a basket of stocks or an exchange
- It is a better measure of the market strength as the AD line index takes into consideration the broader list of stocks from the exchange as compared to just using the main indexes such as the Dow Jones Industrials Average (DJIA) or the S&P500 index
- The AD line index is commonly used in other market breadth indicators such as the ARMS index, the AD ratio line and so on
- The Advance decline line is used by technical analysts to determine the market participation when a security is making a new high. Usually, market tops with lower participation can signal weakness in the security
- A rising advance decline line off an extreme value or a falling advance decline line from an extreme value can signal rising or falling market participation. Based on this, the trader can determine when to enter a trade
- The advance decline line can be used by day traders as well as long term technical traders as it can help to identify potential trading opportunities
4 – What are the benefits of using the Advance Decline Index line?
The market breadth indicators such as the Advance decline index line are part of a unique set of indicators that can tell the trader the overall health of the market. Although the stock indexes such as the Dow Jones 30 or the S&P500 indexes are commonly used as measure of the market, they do not give the complete picture.
For example, the Dow 30 simply tells us how the 30 components of the index are performing. Likewise, the S&P500 index can only tell us how the 500 listed stocks are performing.
The above information is fine as long as one limits their trading to only the large cap stocks. However, the moment a trader ventures into lesser known stocks or small cap stocks, things can start to get very different.
This is where the advance and decline index line and other market breadth indicators can come to the rescue as it offers a more comprehensive view of the stock market.
Key Takeaways
- The advance/decline (A/D) line is a cumulative breadth indicator that adds the net of advancing minus declining stocks each day.
- A rising A/D line confirms a broad-based, healthy rally; a falling line warns that fewer stocks are participating.
- Divergence between the A/D line and a price index can foreshadow a reversal.
- It works best as a confirmation tool alongside price and volume, not in isolation.
Frequently Asked Questions
What is the advance/decline index?
It is a market breadth indicator that cumulatively tracks the net number of advancing versus declining stocks to gauge how broadly the market is participating in a move.
How is the advance/decline line calculated?
Each day you add the difference between advancing issues and declining issues to the prior cumulative total, creating a running line.
What does a divergence in the A/D line mean?
If a price index makes a new high but the A/D line does not, market breadth is weakening, which can be an early warning of a reversal.
What is the difference between the A/D line and the A/D ratio?
The A/D line is a cumulative running total of net advances, while the A/D ratio simply divides advancers by decliners for a single-day reading.
Which markets is the advance/decline line used for?
It is most useful on broad indexes such as the NYSE and Nasdaq composite, where a large number of constituents makes the breadth reading meaningful.
Related TradingSim Guides


 Breadth Indicators


