Just like regular exchange traded funds, a leveraged ETF can get you exposure to a particular sector, but as the name suggests, it uses built in leverage to maximize or minimize the exposure, depending on the directional movement of the market. Hence, before you endeavor trading leveraged ETFs, please remember that it can be a double edged sword.
If you are new to leveraged exchange traded funds (ETFs), and still wondering what a leveraged ETF is, you should first click here and familiarize yourself with what leveraged ETFs are and learn about how this extraordinary trading instrument works.
Finished reading? Great! If you have read the overview regarding leveraged ETFs, you should understand why trading leveraged ETFs in the long-term doesn’t work as well as trading leveraged ETFs in the short-term.
So, in my opinion, what type of leveraged ETF strategy would work better in the short term? The obvious answer is technical trading strategies. This is because changes in fundamentals can take days, or even weeks, to have any noticeable effects on the market. This is especially true, when you are analyzing the entire sector of an ETF based on macroeconomic factors.
Tip # 1 – Know Your Leveraged ETF
“If you know your enemies and know yourself, you will not be imperiled in a hundred battles… if you do not know your enemies nor yourself, you will be imperiled in every single battle.” – Sun Tzu
Well, you are not going to war, but it pays to understand the underlying securities that make up the leveraged ETF. Some commodities and sectors are extremely volatile compared to others, and trading a triple leveraged ETF based on that commodity or industry can completely destroy your entire day’s profits in minutes.
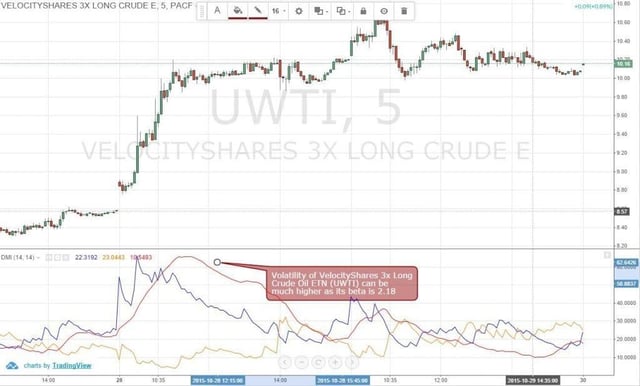
Figure 1: The Volatility of VelocityShares 3X Long Crude ETN (UWTI) Can Be Very High
For example, according to Google Finance, the beta of a triple leveraged oil ETF like the VelocityShares 3X Long Crude ETN (UWTI) is 2.18.
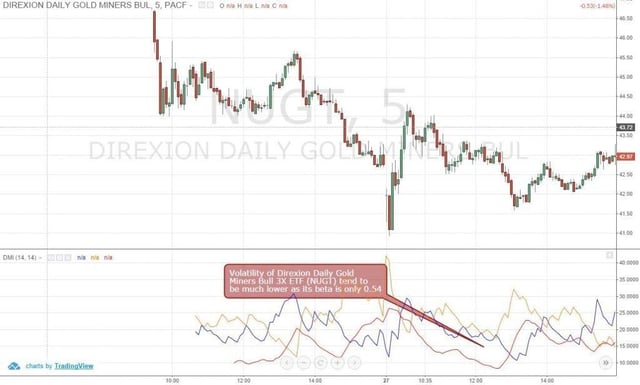
Figure 2: The Volatility of Direxion Daily Gold Miners Bull 3X ETF (NUGT) is Much Lower
On the other hand, the beta of a leveraged gold ETF like the Direxion Daily Gold Miners Bull 3X ETF (NUGT) is only 0.54.
So, you should individually assess the leveraged ETF risk. If you trade UWTI and NUGT with the same trend trading strategy, it would be suicidal. Because NUGT price tends to have a more range-bound price action, while the UWTI would likely establish a trend during the trading day.
Now that you know what to look for in a leveraged ETF to classify it as suitable for trend trading, visit ETFdb’s leveraged etf list and cross-check the beta of the leverage ETF in order to cherry-pick the most volatile ones. You should remember that a beta above 1 indicates a higher volatility compared to the market, whereas a beta below 1 indicates that it has a lower volatility compared to the market.
Tip # 2 – Trading Leveraged ETF Breakouts with Directional Movement Index
Now that you understand why it is better to trend trade volatile leveraged ETFs, like an oil leveraged ETF, let’s discuss a Directional Movement Index strategy that you can apply when trading leveraged oil etf breakouts.
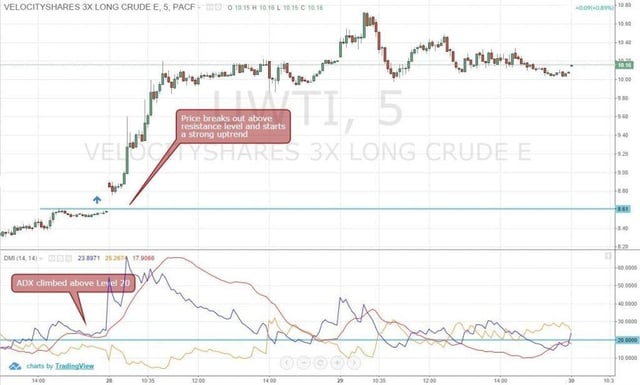
Figure 3: Directional Movement Index Above Level 20 Signals Potential Start of a New Trend
If you are not familiar with any of the Directional Movement Index strategies, here is a quick tip: professional day traders often consider that the leveraged etf instrument is about to start a short-term trend whenever the average directional movement (ADX is the red line on the DMI chart) climbs above 20. However, a lot of traders are more conservative and only consider a reading above 25 to be an indication of a potential trend.
Depending on your own risk appetite, you can decide which level you would like to watch. But, the principle would remain pretty much the same.
When you find that the average line of the Directional Movement Index is climbing above level 20 (or level 25), and the price of the leveraged ETF closed above a significant resistance level, it should be considered as a valid breakout.
In figure 3, the UWTI price was trading between $8.50 and $8.61, while the ADX value climbed above level 20. It indicated that this could be the start of an uptrend. If you find the market in this kind of situation, you should place a market order to buy the leveraged etf the moment the price climbed above the high of the range and closes above it.
Tip # 3 – Trend Trading Leveraged ETFs with Directional Movement Index
As we discussed earlier, the reason you should pick highly volatile leveraged ETFs for short-term day trading is that these tend to trend a lot. By applying the Directional Movement Index indicator, you can easily capture the bulk of the short-term trends of leveraged ETFs.
Even if you already have a long position, the Directional Movement Index can help you to scale-in and increase your exposure in the sector of the leveraged ETF.
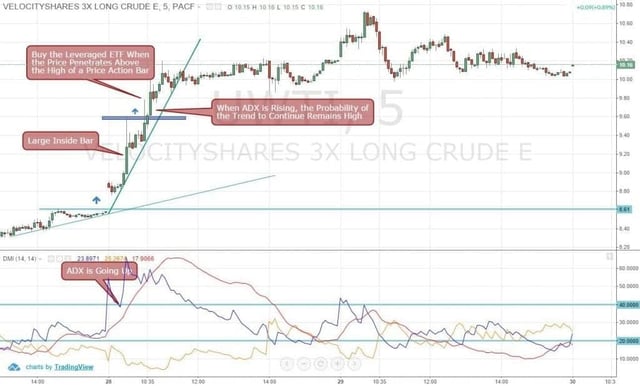
Figure 4: When ADX is Rising, There is a High Probability That the Trend Will Continue
A rising average directional index (ADX) indicates that the underlying trend is gaining strength. Hence, when you find the ADX of the leveraged ETF is gaining momentum, and the line is going up, you should look for opportunities to increase your exposure.
There are a number of ways you can scale-in or add additional positions to your trade. For example, by combining other technical indicators with the Directional Movement Index signal, such as moving average crossovers or even price action, to scale-in to a position.
In figure 4, after breaking out of the consolidation, the Directional Movement Index of the UWTI leveraged ETF continued to rise and went above level 40. When the Directional Movement Index value approaches level 40, you should consider that the leveraged ETF is in a strong trend and look for signals to scale-in. On this occasion, the UWTI price formed a large inside bar (IB) after the breakout.
Along with the rising Directional Movement Index, the formation of the inside bar signaled a trend continuation. You could have easily entered an additional long position when the UWTI price penetrated the high of the inside bar and increased your exposure as a part of your leveraged investment strategy.
Tip # 4 – Using Directional Movement Index for Trading a Range Bound Leveraged ETF
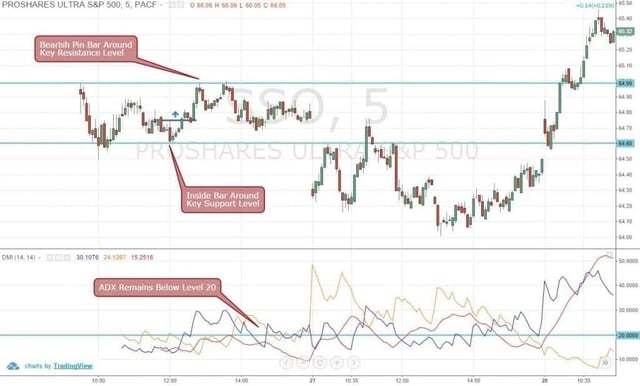
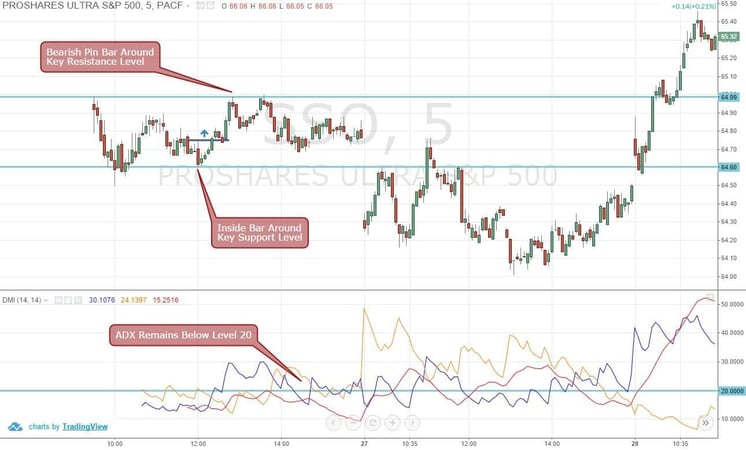
Figure 5: Using Directional Movement Index for Trading Range Bound ProShares Ultra S&P 500 (SSO)
When you find a leveraged ETF is trading within a range and the Directional Movement Index is lurking below 20, you can be certain that the likelihood of a breakout is slim. Hence, you can easily buy near the support and exit the position near resistance and make some easy money in the process.
In the trade example above (figure 5), you can see that the ProShares Ultra S&P 500 (SSO) formed an inside bar around the support level while the Directional Movement Index reading was below 20. So, you could have been pretty sure that there was a high probability that the ProShares Ultra S&P 500 (SSO), which is a leveraged s&p 500 ETF, would have continued to remain within support and resistance level.
So, if you place a buy order when the SSO price penetrated the high of this inside bar, you could easily capture the bullish move towards the resistance level. In this instance, when the SSO price approached the resistance level, the Directional Movement Index reading was rising, but still remained below 20. Therefore, you could have simply closed out the long position and exited the trade with a bulk of the profits. Then again, if the Directional Movement Index reading climbed above 20, you could wait for a potential breakout instead!
Conclusion
A leveraged ETF trading strategy that uses the Directional Movement Index can prove to be a great way to make some quick profits, especially on short time frames like the 5 minute chart.
Since leveraged ETFs have built-in leverage, institutional traders often use these instruments to day trade large funds that cannot utilize leverage due to regulatory reasons. This attracts a lot of liquidity and increases the volatility level of certain leveraged ETFs. This offers some great day trading opportunities for retail traders who solely depend on technical trading strategies to capture the short-term movements in the market.
If you are happy to handle large price swings and live to trade volatile instruments, leveraged ETFs can offer a lot of opportunities for short-term trading. By combining the tips regarding Directional Movement Index with some common sense, you can successfully trade leveraged ETFs and make decent profits.


 Basics of Stock Trading


