The moving average is one of the most widely used indicators in all of trading. There are different types of moving averages based on the calculation method and duration (periods).
Today we will discuss one of the most popular of all moving averages – the 200-day simple moving average. We will describe its structure and 5 tips for using the 200-day simple moving average when trading.
Ready to dive in?
Exactly How does the Moving Average Work?
The moving average smoothes the price action of a stock or financial instrument by taking the mean or average price movement over a given number of periods.
This way, instead of tracking every price movement like a tick chart or highs and lows of a candlestick; the moving average simply calculates its value based on the closing price.
This, of course, distills the price action down to one point for a period, thus providing a simple lens into the price action.
In theory, this provides you the trader, a straightforward, simplistic view of where the price has been and is likely to go in the short-term.
You can customize your moving average by changing the periods. For example, if you want to measure the price movements over a shorter duration, you will likely want to go with 10 periods or less.
If you are more concerned with the longer-term view, you will want to go 50 periods or greater.
Let’s now review an example of how the simple moving average is calculated [1] in the below table:
| Period |
Price |
5-Period SMA |
10-period SMA |
15-Period SMA |
20-period SMA |
| 1 |
100 |
|
|
|
|
| 2 |
110 |
|
|
|
|
| 3 |
115 |
|
|
|
|
| 4 |
120 |
|
|
|
|
| 5 |
130 |
115 |
|
|
|
| 6 |
135 |
122 |
|
|
|
| 7 |
128 |
125.6 |
|
|
|
| 8 |
120 |
126.6 |
|
|
|
| 9 |
115 |
125.6 |
|
|
|
| 10 |
111 |
121.8 |
118.4 |
|
|
| 11 |
109 |
116.6 |
119.3 |
|
|
| 12 |
105 |
112 |
118.8 |
|
|
| 13 |
100 |
108 |
117.3 |
|
|
| 14 |
104 |
105.8 |
115.7 |
|
|
| 15 |
112 |
106 |
113.9 |
114.2666667 |
|
| 16 |
119 |
108 |
112.3 |
115.5333333 |
|
| 17 |
125 |
112 |
112 |
116.5333333 |
|
| 18 |
132 |
118.4 |
113.2 |
117.6666667 |
|
| 19 |
136 |
124.8 |
115.3 |
118.7333333 |
|
| 20 |
140 |
130.4 |
118.2 |
119.4 |
118.3 |
| 21 |
148 |
136.2 |
122.1 |
120.2666667 |
120.7 |
| 22 |
150 |
141.2 |
126.6 |
121.7333333 |
122.7 |
| 23 |
158 |
146.4 |
132.4 |
124.2666667 |
124.85 |
| 24 |
164 |
152 |
138.4 |
127.5333333 |
127.05 |
| 25 |
171 |
158.2 |
144.3 |
131.5333333 |
129.1
|
This table gives an example of 25 periods.
You could use these periods to calculate the simple moving averages for the 5-period SMA, 10-period SMA, 15-period SMA and the 20-period SMA.
The 5-period SMA needs 5 periods to begin printing a value. Therefore, the first 4 entries in the 5-Period SMA column are empty.
The 10-period SMA needs 10 periods to begin printing a value. Therefore, the first 9 entries in the 10-Period SMA column are empty. It works the same way for the 15 and 20-period SMAs.
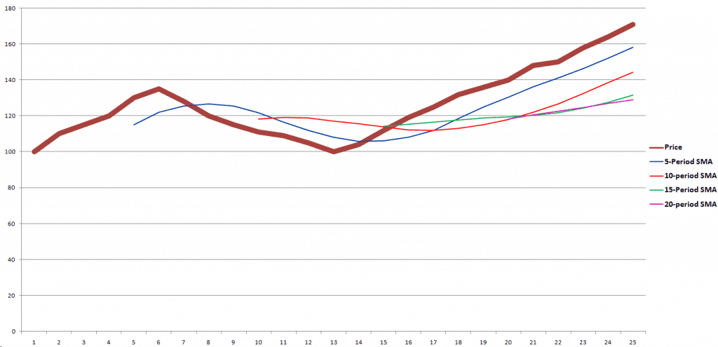
When you visualize the data, you see 5 lines on the chart: the price action, 5, 10, 15, and 20-period SMAs.
Price and Moving Averages
The thick line illustrates the actual closing price values.
The other lines are the moving averages. Note that each of these starts with a delay because it needs preliminary values in order to start the calculation.
The 20-period simple moving average (pink) is barely visible in the right of the chart. After all, this SMA needs 20 periods in order to start printing values This means, that periods from 1 to 25 contain only six 20-period SMA values. These are the values from the periods (1-20), (2-21), (3-22), (4-23), (5-24), and (6-25).
Since there is a minimum number of price periods required to calculate the moving average, the indicator clearly falls in the lagging indicator column.
Hence the greater the number of periods, the greater the lag.
All clear so far?
200-Day Simple Moving Average
The 200-day simple moving average is one of the most important tools when trading.
The simple reason, all traders and I mean all are aware of the number of periods and actively watch this average on the price chart.
Since there are so many eyes on the 200-day simple moving average, many traders will place their orders around this key level.
Some traders will look for the 200-day to act as resistance, while others will use the average as a buying opportunity with the assumption major support will keep the stock up.
For this reason, the price action tends to conform to the SMA 200 moving average quite nicely.
The 200-day simple moving average refers to 200 periods on the daily chart. This takes 200 trading days into consideration – which is a ton of trading days.
Remember, there is only about 252 [2] trading days in a year, so the SMA 200 is a big deal.
This is how a 200-day moving average looks on the chart:
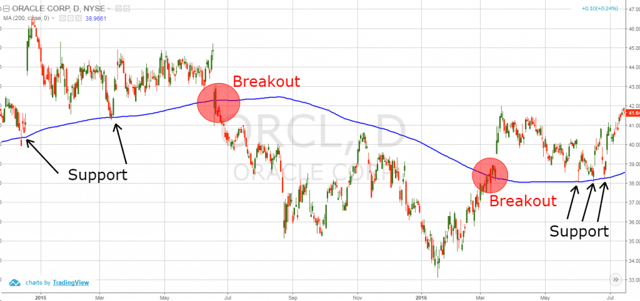
200-Day Simple Moving Average
The blue line is the 200-day simple moving average. See that the line acts as a support at some points and conversely can trigger significant selling when breached to the downside.
One rule of thumb is when price breaks the average, it tends to continue moving in the direction of the breakout with vigor.
Signals of the 200-Day SMA
There are two basic signals in relation to the 200-day simple moving average:
1) If the price is above the 200-day SMA this is a bullish signal.
2) If the price is below the 200-day SMA this is a bearish signal.
Now, before you go running off and shouting how you are an expert, this is just the fisher price level of understanding.
Let’s dig a little further.
200-Day SMA Buy Signals
Bullish Breakout: When the price action breaks the 200-day SMA upwards it gives a strong long signal.
Support Bounce: When the price action meets the 200-day SMA as a support and bounces upwards, it creates a strong buy signal.
200-Day SMA Sell Signals
Bearish Breakout: When the price action breaks the 200-day SMA downwards, it creates a strong short signal.
Resistance Bounce: When the price action meets the 200-day SMA as resistance and bounces downwards, it gives a very strong short signal.
It is important to mention that the 200-day SMA usually foretells long-term price moves. This makes it a very attractive technical tool for long-term investors.
5 Tips for Using a 200-Day Moving Average
1) Make sure the price action respects the 200-day moving average
Before you do anything with the 200-day moving average, you first need to see if the traders controlling the stock care.
In any stock, there are the traders which are controlling the price movement. Therefore, you need to see if these traders are looking at the 200-day SMA or if they are looking at some other chart formation or indicator to make their trading decisions.
So, again, is the price action respecting the 200-day? If yes, great, move on to tip #2.
If not, find out what your pool of traders is tracking and get on board.
2) Use the Volume Indicator when trading the 200-day SMA
Volumes are crucial when trading with the 200-day moving average. If volumes are high, then the stock is likely to be more volatile and more certain in its breakout.
If the price meets the 200-day moving average with low volume, then the average is more likely to suppress the price action or provide support on a pullback.
Just to be clear, high or low volume are neither negative nor positive. It all depends on which way you are trading the market in order to determine if the volume action proves to be a friend or foe.
3) Trade Breakouts through the 200-day moving average only if volumes are high
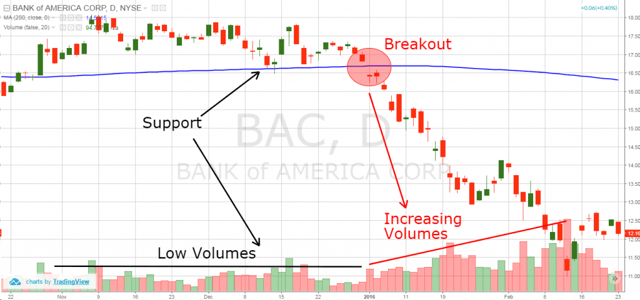
200-Day Simple Moving Average Breakout
In the image above, you see that a small bounce appears during low volumes. The 200-day SMA acts as support, but a significant move is not created due to the absence of volumes. The real move appears when the price breaks the SMA during high trading volumes.
After the high volume break lower, a significant price move ensues.
4) Bounces give a higher Win-Loss ratio
While breakouts feel great when you are on the right side of the trade, remember the market only trends impulsively about 20% of the time.
So, if you want to make consistent profits, you will also need to understand how to trade the other 80% of the times.
Therefore, when you see the 200-day moving average, but ready to pull the trigger on bounce trades off the 200-day.
The beauty of playing the 200-day is that you can place tight stops on the other side of the trade as the price action begins to congest around the 200-day moving average.
The ability to place this tight stop loss is the reason the win-loss ratio is so high with the bounce patterns.
5) Exercise Patience with 200-Day Moving Average Breakouts
You should be cautious when trading breakouts with the 200-day SMA.
Let me quantify patience. If you see the price breaking the 200-day moving average, wait to see if it is able to close above the average. In trading, you don’t get a medal for being the first person to jump into a trade.
Let the bulls or bears prove they are in control, then enter the trade on the next candlestick if the price continues in the same direction.
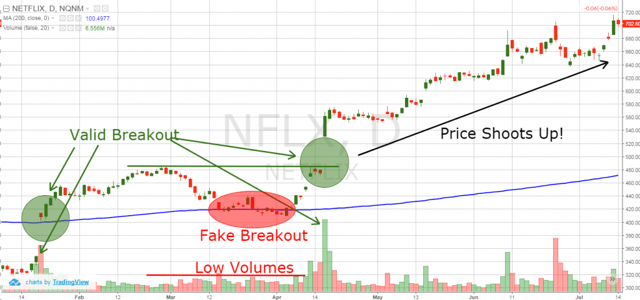
Patience when trading 200-day moving average
On this image, you see the difference between valid and a fake breakout with the 200-day SMA.
Notice how a valid breakout appears during high volumes.
After the breakout, the price has the momentum to continue much higher.
To further illustrate this point, I was reading an article from CBS Marketwatch [3] where it touches on the number of failed signals from the 200-period moving average during the recent bull runs of all bull runs.
So, again, it’s more about being patient and letting the chart setup and not just entering on every signal from the moving average.
200 SMA Trading Example
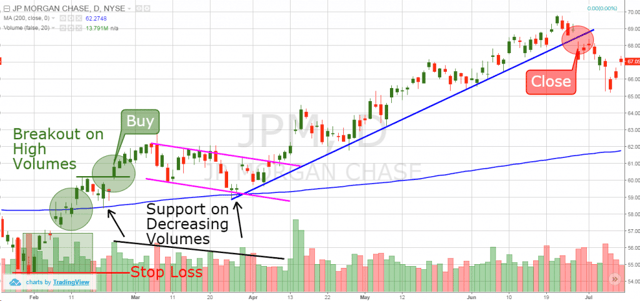
200-Day SMA Trading Example
Above is the stock chart of JP Morgan Chase & Co. from February through June. The blue line is the 200-day SMA.
The 200-day moving average chart starts with a bullish breakout through the blue line with high volume.
The price then creates a top above the breakout zone and ultimately pulls back to the 200-day SMA. On this pullback, you notice that the volume is drying up.
This is a sign to you that any bearish activity is being used by the major players to accumulate more of the stock.
We open a long trade and place a stop loss below the low prior to the break of the 200-day moving average.
The volumes then decrease and the price action returns to the 200-SMA for another test. The price bounces quietly from the line with relatively low volume.
Suddenly, the price breaks a pink flag upwards during with high trading volume.
JPM then begins a strong impulsive move higher, which lasts for three months. We exit the trade the moment the price breaks the blue bullish trend line downwards.
This one trade would have netted over 10% in profit with a low beta Dow stock.
Not bad if you ask me!
Conclusion
- Moving averages are arguably the most popular indicator in all of technical analysis.
- One of the most important moving averages is the 200-day SMA.
- There are many eyes looking at the 200-day SMA, which makes it a significant psychological level.
- The two basic trading rules for the 200 SMA are:
- When the price is above, you should go long.
- When the price is below, you should be short.
- There are two groups of 200-day SMA signals;
- 200-day SMA buy signals
- Bullish Breakout
- Support Bounce
- 200-day SMA sell signals
- Bearish Breakout
- Resistance Bounce
- Our 5 Tips for Using the 200-day moving average:
- Make sure the price action respects the 200-day moving average
- Use the Volume Indicator when trading the 200-day SMA
- Trade breakouts through the 200-day moving average only if volumes are high
- Bounces give a higher win-loss ratio
- Exercise Patience with 200-day moving average breakouts
External References
- Number of Trading Days. Wikipedia.com
- Technical Analysis Introduction. University of California, Berkeley. p. 21
- Hulbert, Mark. (2018). You Can No Longer Trust the 200-Day Moving Average as a Stock Market Indicator [Article]. Marketwatch.com


 Overlay Indicators


